Fig. 6
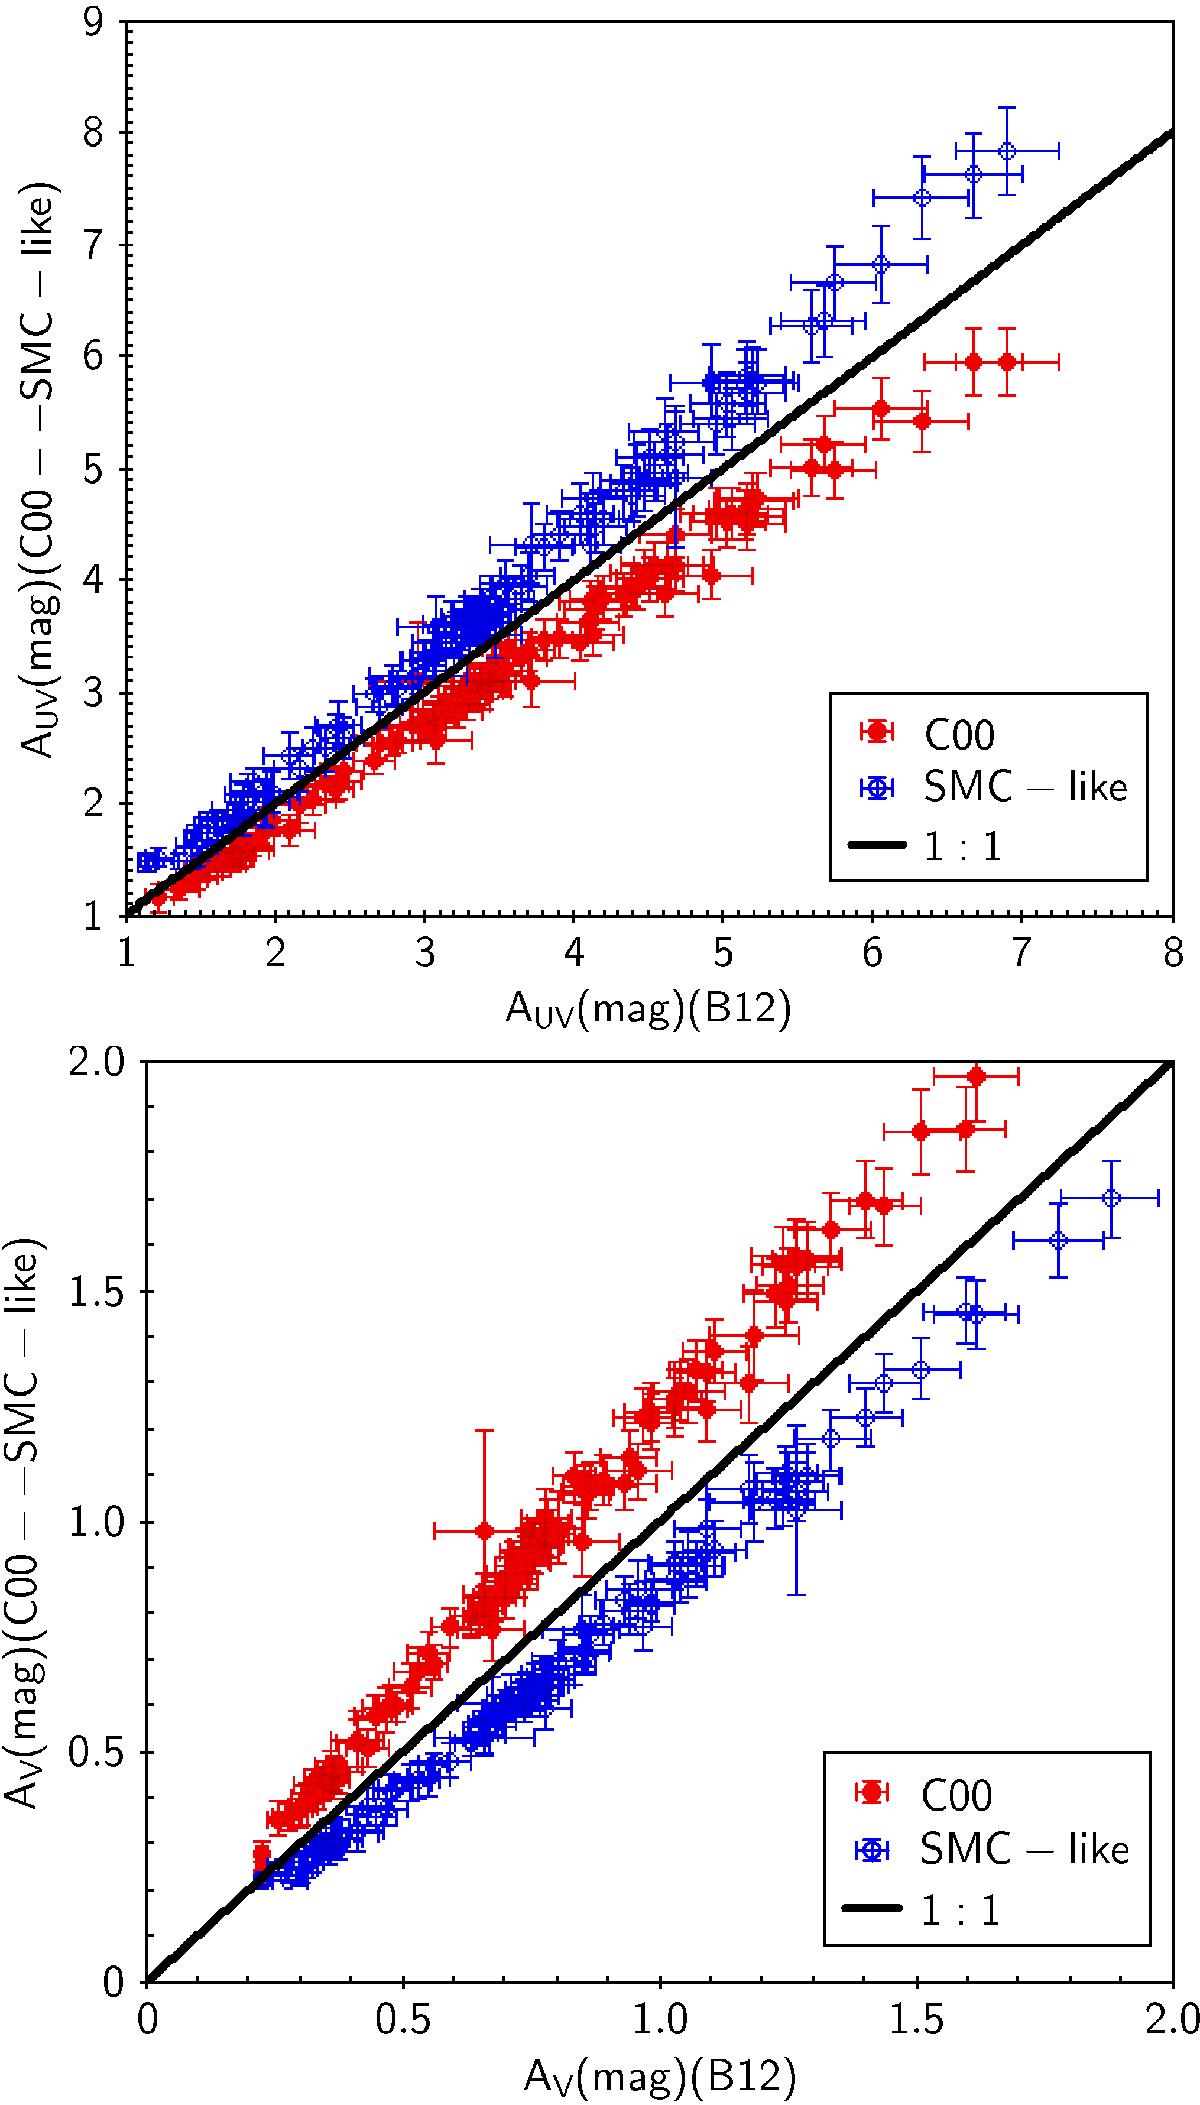
Comparison of attenuation factors in the UV (upper panel) and in the V band (lower panel) for the different attenuation curves. The values found for the B12 attenuation curve are plotted on the x-axis, and those found for the C00 (filled red circles) and SMC-like (blue empty circles) attenuation curves are plotted on the y-axis. The dispersion of the measures is reported as an error bar.
Current usage metrics show cumulative count of Article Views (full-text article views including HTML views, PDF and ePub downloads, according to the available data) and Abstracts Views on Vision4Press platform.
Data correspond to usage on the plateform after 2015. The current usage metrics is available 48-96 hours after online publication and is updated daily on week days.
Initial download of the metrics may take a while.