Fig. 5
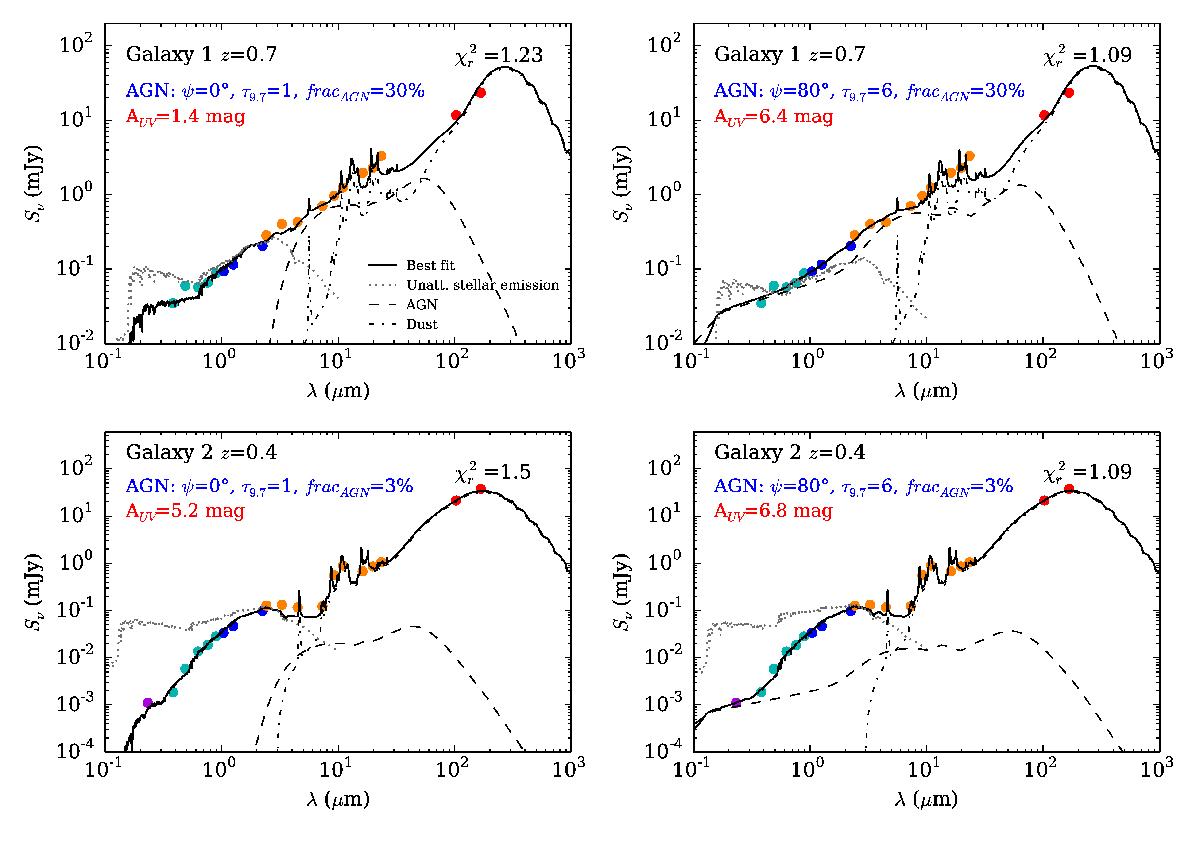
Examples of fits with the two scenarios for the AGN component. Symbols and lines are the same as in Fig. 3. Galaxy 1 (upper panels) is detected in X-ray and identified as an AGN type 1, galaxy 2 (lower panels) is a “typical” galaxy of our sample, without any X-ray detection or spectral classification. The left panels correspond to best models obtained with scenario 1 (τ9.7 = 1,6, ψ = 0° ) and right panels correspond to best models obtained with scenario 2 (τ9.7 = 6 and ψ = 0,80°). All fits are good with consistent AGN fractions but the amount of dust attenuation varies according to the adopted scenario.
Current usage metrics show cumulative count of Article Views (full-text article views including HTML views, PDF and ePub downloads, according to the available data) and Abstracts Views on Vision4Press platform.
Data correspond to usage on the plateform after 2015. The current usage metrics is available 48-96 hours after online publication and is updated daily on week days.
Initial download of the metrics may take a while.