Fig. 4
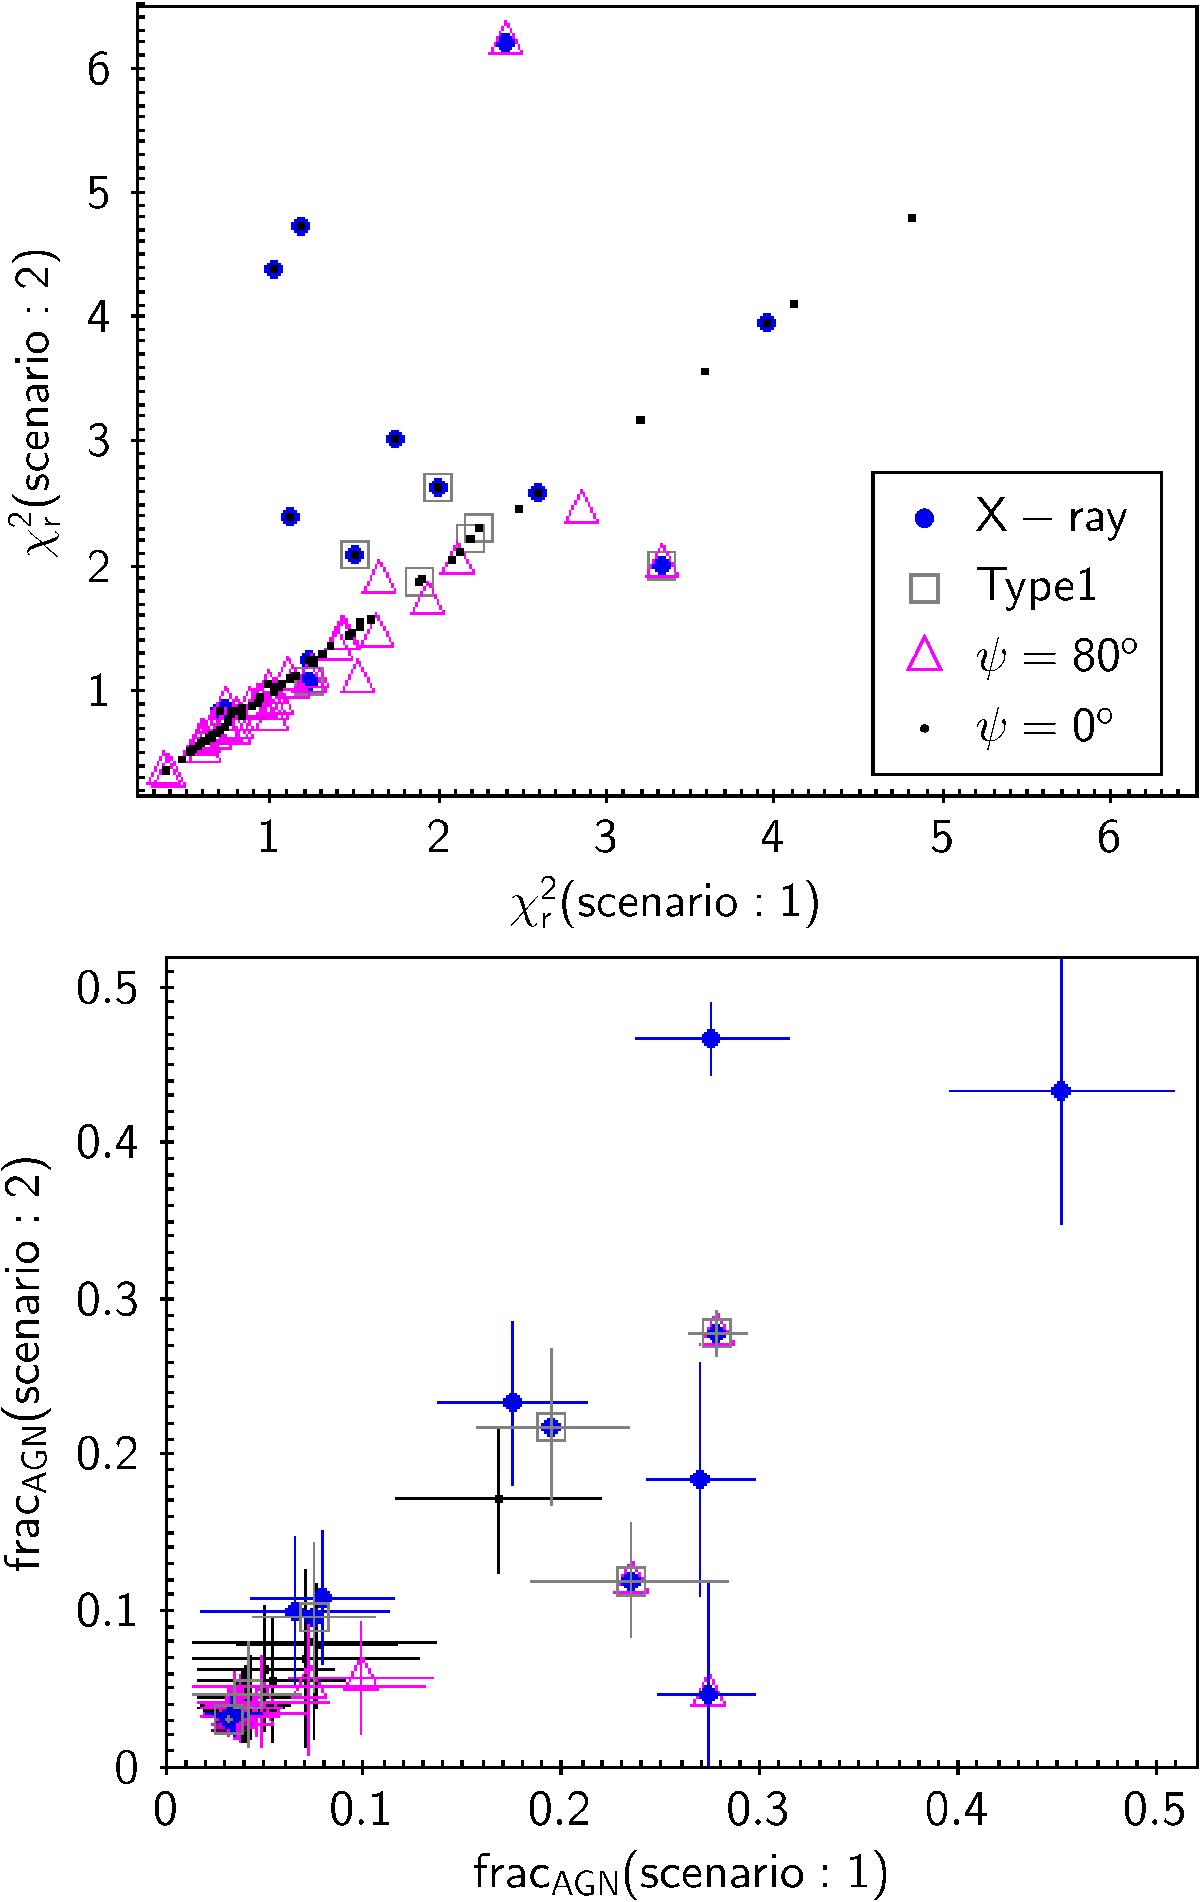
Comparison of ![]() and AGN fractions (fracAGN) for the SPECZ sample. The results with scenario 1 for the AGN component (τ9.7 = 1,6 and ψ = 0°) are plotted on the x-axis and those for scenario 2 (τ9.7 = 6 and ψ = 0,80°) on the y-axis. Galaxies detected in X-ray, and galaxies spectroscopically classified as AGN type 1 are plotted with blue points and empty squares, respectively. The objects best fitted with either ψ = 0° or ψ = 80° for scenario 2 are differentiated (black points and pink empty triangles). The dispersion on the estimations of the AGN fraction (1σ dispersion of the PDFs) is plotted with error bars.
and AGN fractions (fracAGN) for the SPECZ sample. The results with scenario 1 for the AGN component (τ9.7 = 1,6 and ψ = 0°) are plotted on the x-axis and those for scenario 2 (τ9.7 = 6 and ψ = 0,80°) on the y-axis. Galaxies detected in X-ray, and galaxies spectroscopically classified as AGN type 1 are plotted with blue points and empty squares, respectively. The objects best fitted with either ψ = 0° or ψ = 80° for scenario 2 are differentiated (black points and pink empty triangles). The dispersion on the estimations of the AGN fraction (1σ dispersion of the PDFs) is plotted with error bars.
Current usage metrics show cumulative count of Article Views (full-text article views including HTML views, PDF and ePub downloads, according to the available data) and Abstracts Views on Vision4Press platform.
Data correspond to usage on the plateform after 2015. The current usage metrics is available 48-96 hours after online publication and is updated daily on week days.
Initial download of the metrics may take a while.