Fig. 3
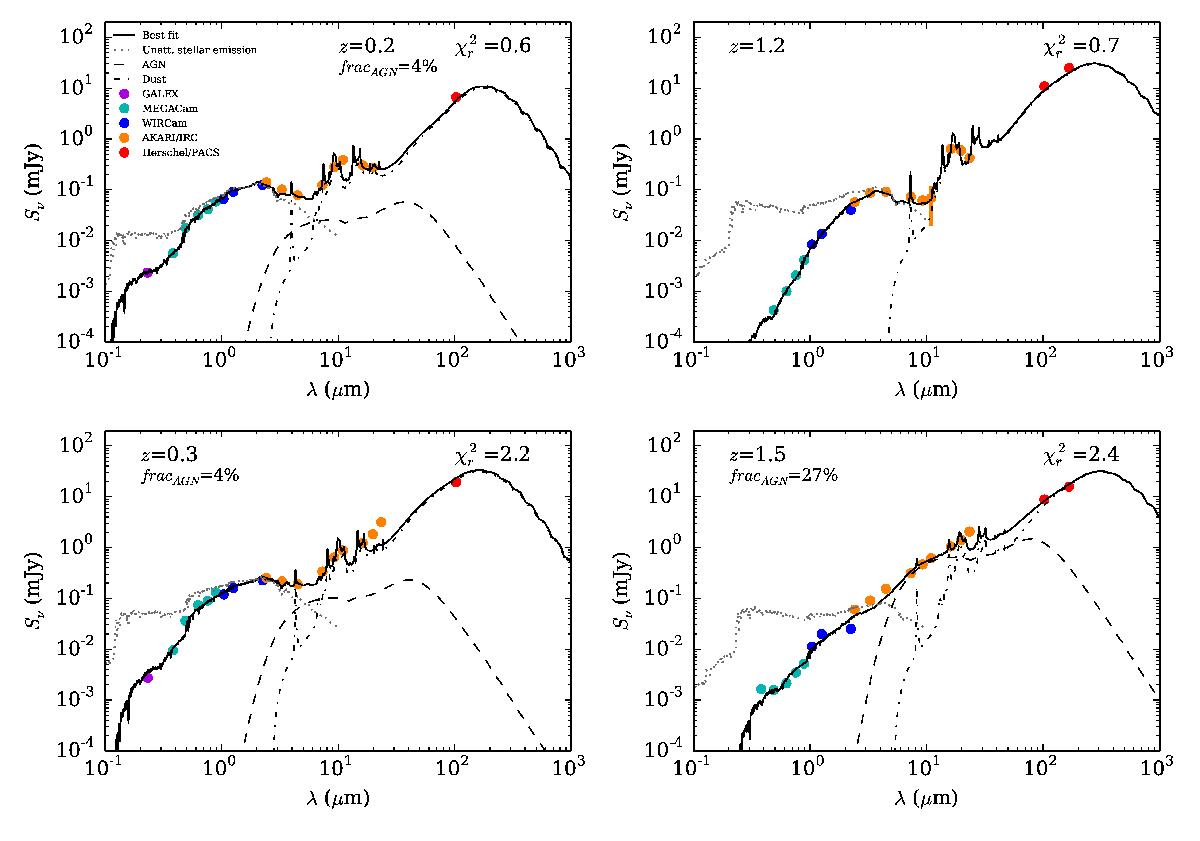
Examples of fits for the SPECZ sample with various redshifts, ![]() values, and AGN contributions. The observed wavelength is plotted on the x-axis. On the y-axis the observed fluxes are plotted with colored points. The best model and its different components (spectra of the unattenuated stellar, dust (thermal) and AGN emission) are plotted as lines. The different colors and lines are described in the legend inside the top left plot. In the top right plot the value of fracAGN is not reported since we do not find any AGN component for this source.
values, and AGN contributions. The observed wavelength is plotted on the x-axis. On the y-axis the observed fluxes are plotted with colored points. The best model and its different components (spectra of the unattenuated stellar, dust (thermal) and AGN emission) are plotted as lines. The different colors and lines are described in the legend inside the top left plot. In the top right plot the value of fracAGN is not reported since we do not find any AGN component for this source.
Current usage metrics show cumulative count of Article Views (full-text article views including HTML views, PDF and ePub downloads, according to the available data) and Abstracts Views on Vision4Press platform.
Data correspond to usage on the plateform after 2015. The current usage metrics is available 48-96 hours after online publication and is updated daily on week days.
Initial download of the metrics may take a while.