Fig. 12
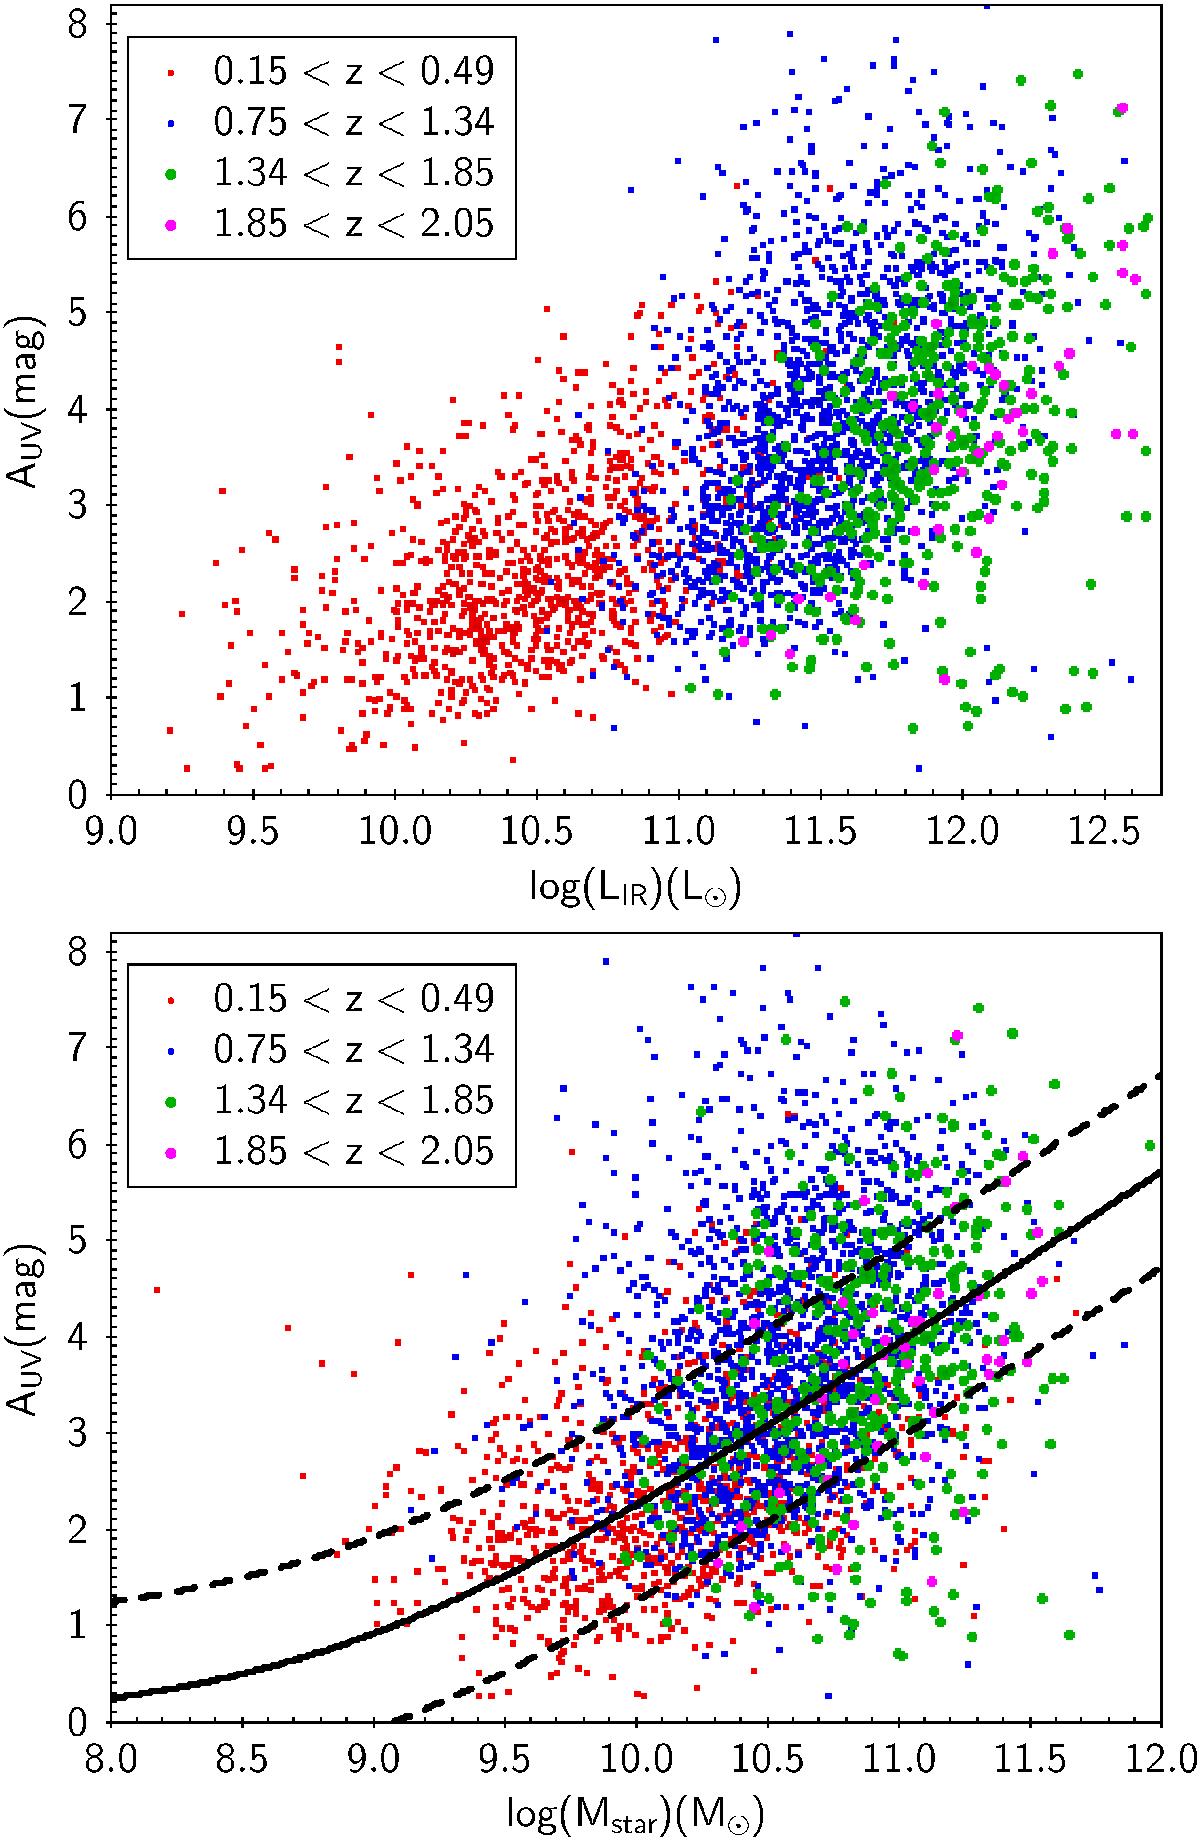
Attenuation factor, AUV, versus LIR (upper panel) and Mstar (lower panel). The color coding is the same as in Fig. 8, larger symbols are used for bins 3 and 4 to improve their visibility. In the lower panel, the relation of Heinis et al. (2014) is plotted with a black solid line, the dotted line is the 1σ dispersion of the relation (see text for details).
Current usage metrics show cumulative count of Article Views (full-text article views including HTML views, PDF and ePub downloads, according to the available data) and Abstracts Views on Vision4Press platform.
Data correspond to usage on the plateform after 2015. The current usage metrics is available 48-96 hours after online publication and is updated daily on week days.
Initial download of the metrics may take a while.