Fig. 10
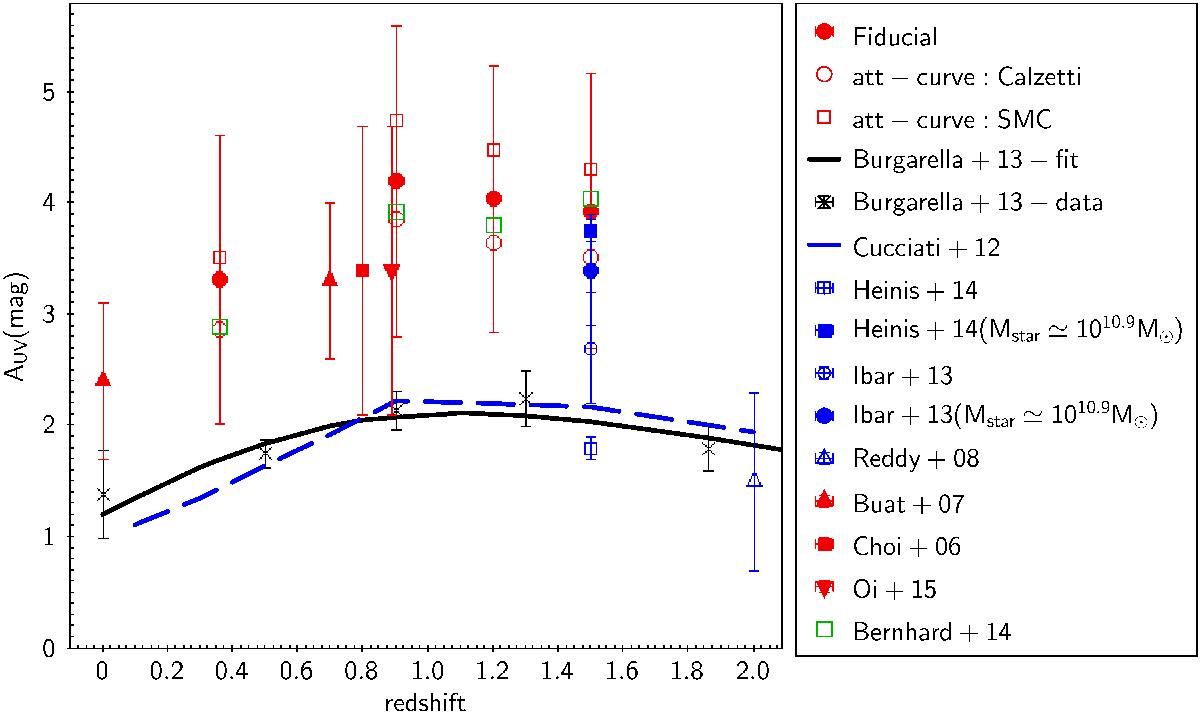
Average values of the attenuation factor, AUV, versus redshift. The red symbols refer to IR selected samples. The results of the present study are plotted with red-filled circles for the fiducial modeling, empty circles and squares are used for the C00 and SMC-like attenuation laws. Measurements from Buat et al. (2007a,b) are plotted with red-filled triangles, those from Choi et al. (2006) and Oi et al. with a filled red square and a filled red triangle. The blue symbols and lines refer to UV and Hα line selections discussed in Sect. 5. Cucciati et al. (2012) results are reported with a blue-dashed line. The blue squares refer to measurements from Heinis et al. (2014) based on a stacking analysis: the empty square for the whole UV selection and the filled square for galaxies with Mstar = 1010.9M⊙. The blue circles refer to measurements from Ibar et al. (2013) for Hα emitters: the empty circle is for the whole selection and filled circle for galaxies with Mstar = 1010.9M⊙. The blue empty triangle refers to measurements from Reddy et al. (2008). The black line and crosses correspond to the global estimates of Burgarella et al. (2013) based on luminosity functions. Their analytical relation is plotted as a solid line and crosses correspond to their measurements at different redshifts. The dispersion of each measurement is reported with a vertical bar. The measure of the dispersion for the Heinis et al. (2014) values are based on a stacking analysis whereas the others are estimated based on individual detections. The green empty squares are the average values of the attenuation found with the model of Bernhard et al. (2014), discussed in Sect. 5.
Current usage metrics show cumulative count of Article Views (full-text article views including HTML views, PDF and ePub downloads, according to the available data) and Abstracts Views on Vision4Press platform.
Data correspond to usage on the plateform after 2015. The current usage metrics is available 48-96 hours after online publication and is updated daily on week days.
Initial download of the metrics may take a while.