Fig. 4
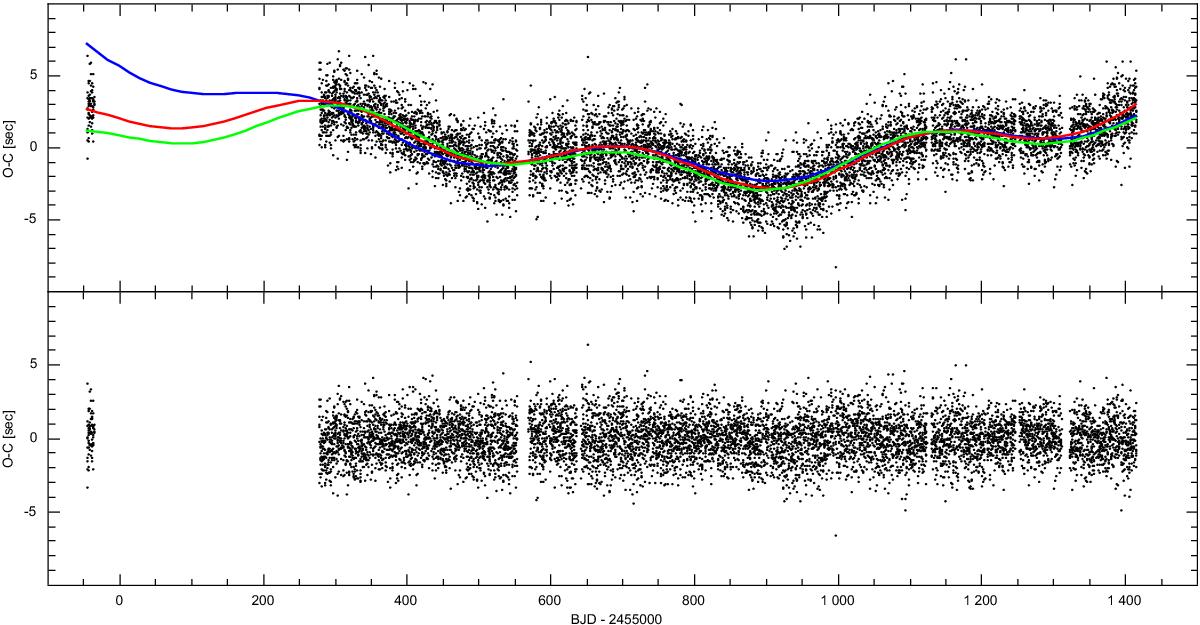
Top panel: the O−C diagram for primary minima based on mid-points derived with the KW method overplotted with the three fits we applied. The blue line represents a parabola+sine fit, the red line represents a sine+sine+line fit, and the green one shows a sine+sine fit. Bottom panel: residuals after the sine+sine+line fit removal.
Current usage metrics show cumulative count of Article Views (full-text article views including HTML views, PDF and ePub downloads, according to the available data) and Abstracts Views on Vision4Press platform.
Data correspond to usage on the plateform after 2015. The current usage metrics is available 48-96 hours after online publication and is updated daily on week days.
Initial download of the metrics may take a while.