Free Access
Fig. 7
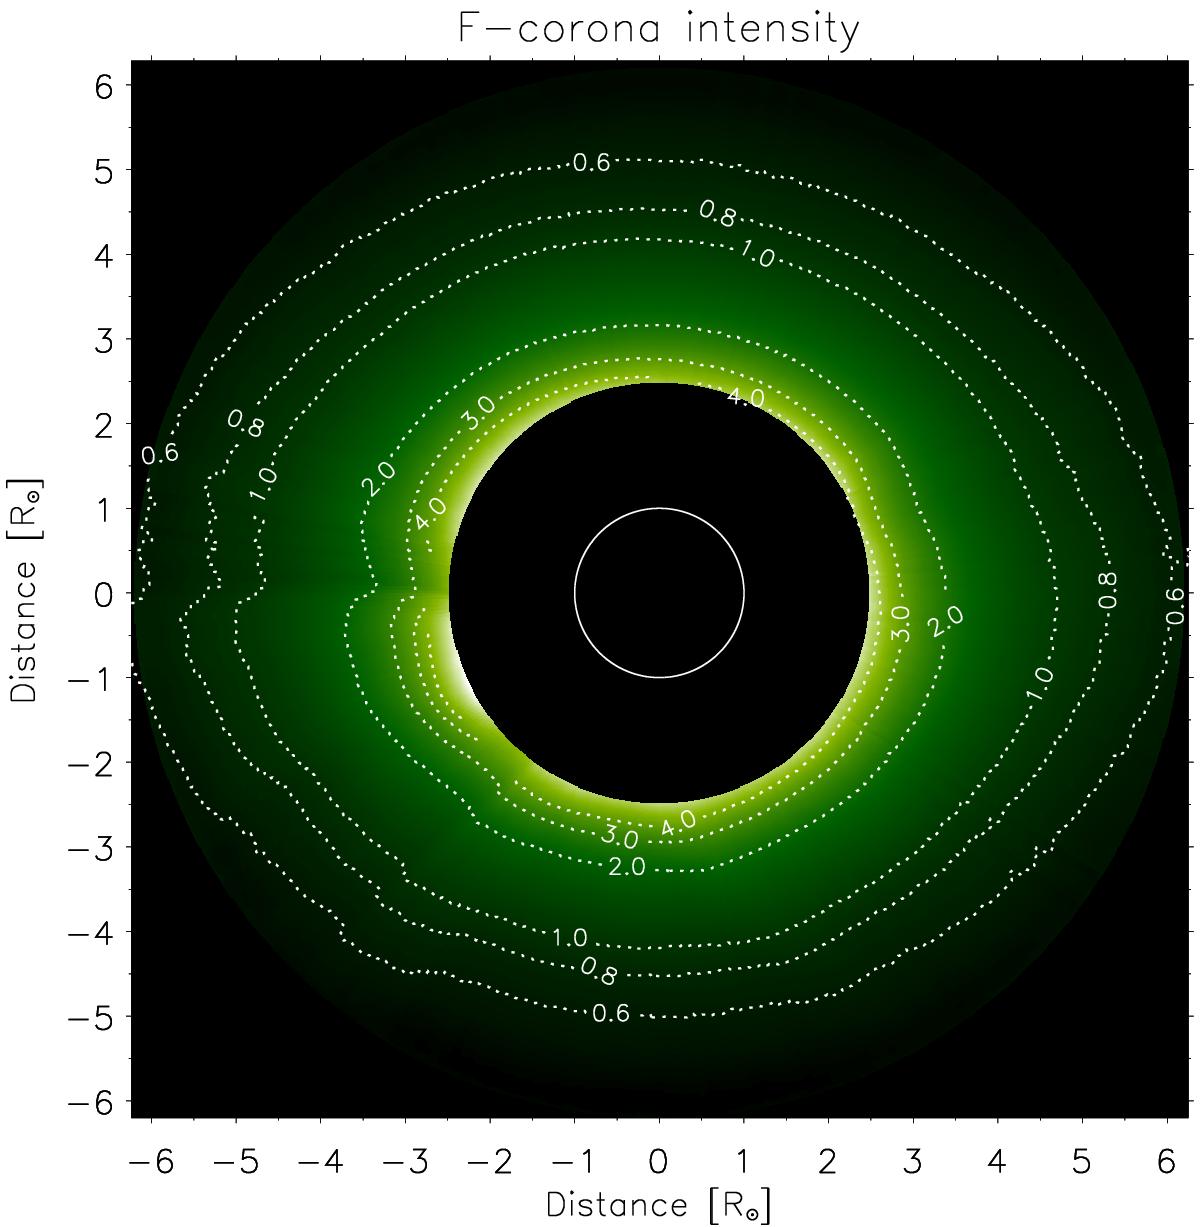
Intensity map of the F-corona in the LASCO C2 FOV, obtained combining the total and polarized brightness taken on March 11, 2008, at 9:07 and 9:00 UT, respectively. The contour levels (dotted lines) are reported in units of 1 × 10⁻⁹ mean solar brightness (MSB). The solid line outlines the limb of the solar disk.
Current usage metrics show cumulative count of Article Views (full-text article views including HTML views, PDF and ePub downloads, according to the available data) and Abstracts Views on Vision4Press platform.
Data correspond to usage on the plateform after 2015. The current usage metrics is available 48-96 hours after online publication and is updated daily on week days.
Initial download of the metrics may take a while.