Free Access
Fig. 10
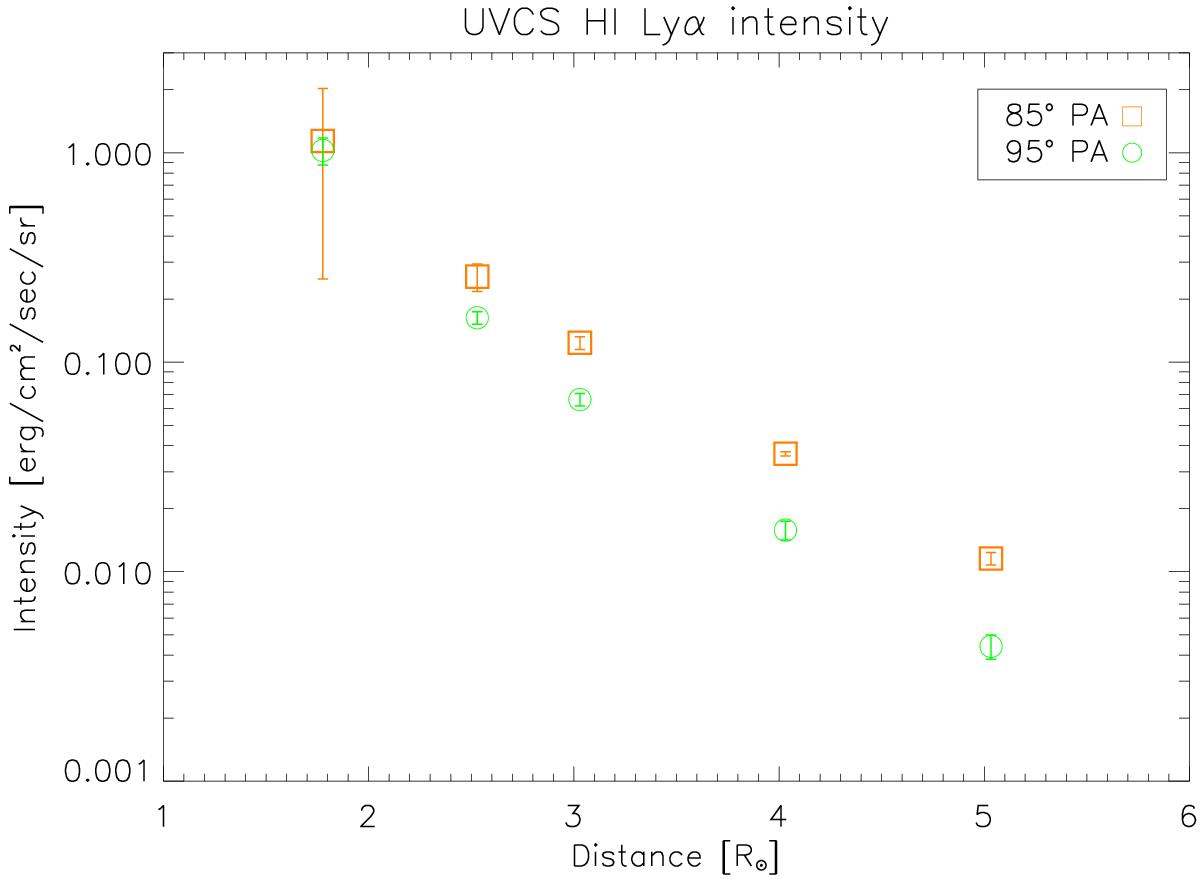
UVCS H I Lyα line intensity at 1.77, 2.53, 3.03, 4.03, and 5.03 R⊙, along the streamer axis (85° PA, orange squares) and the southern boundary of the streamer (95° PA, green circles). The error bars are smaller than the symbol size for certain points.
Current usage metrics show cumulative count of Article Views (full-text article views including HTML views, PDF and ePub downloads, according to the available data) and Abstracts Views on Vision4Press platform.
Data correspond to usage on the plateform after 2015. The current usage metrics is available 48-96 hours after online publication and is updated daily on week days.
Initial download of the metrics may take a while.