Fig. 6
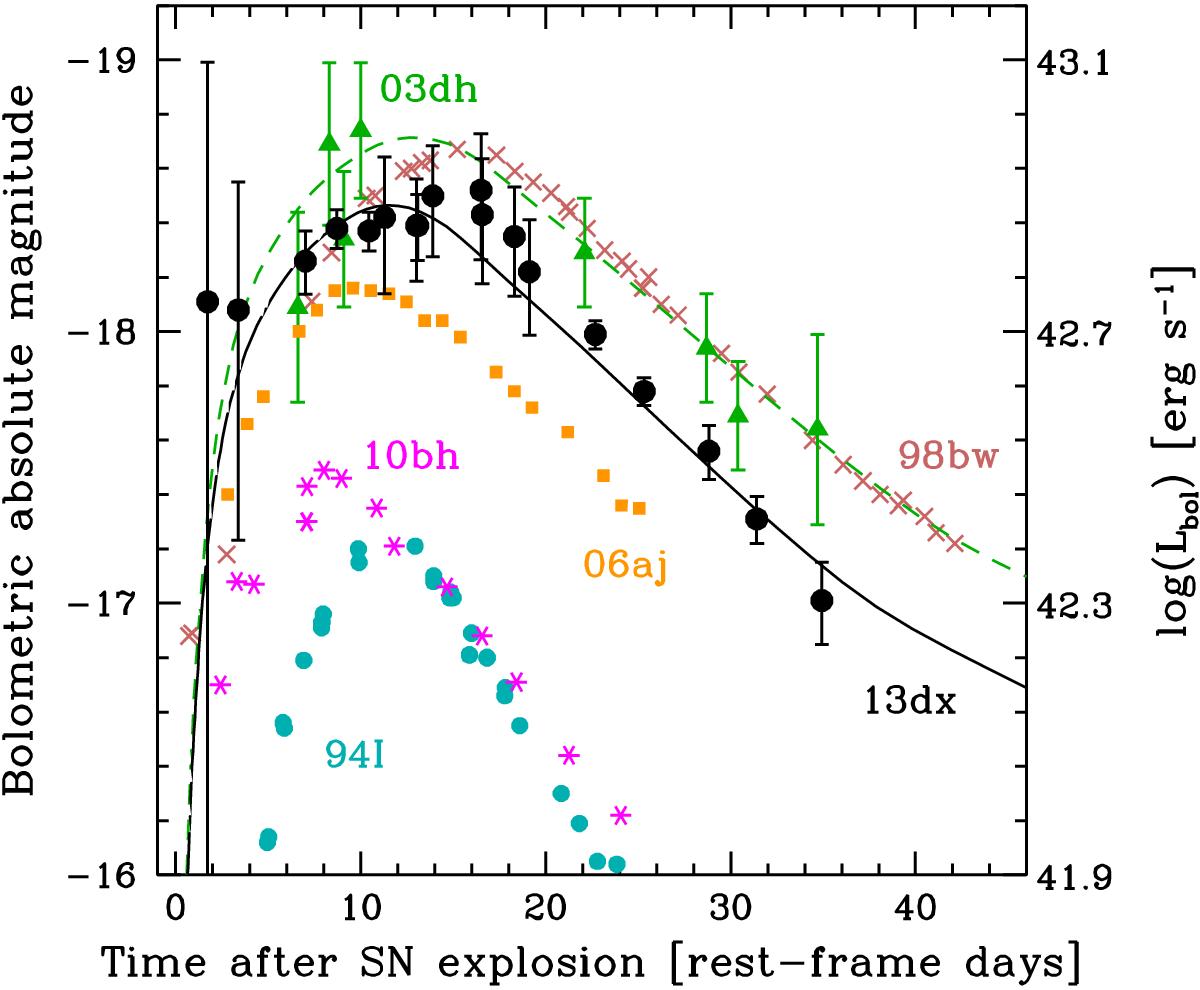
Bolometric light curve of SN 2013dx (large circles) compared with those of other core-collapse type Ic SNe associated with a GRB or XRF (SNe 1998bw, crosses; 2003dh, triangles; 2006aj, squares; 2010bh, asterisks) and not associated with any detected high-energy event (SN1994I, small circles). Before day 20, several points of SN2013dx are affected by larger uncertainties than at later epochs, despite the higher brightness, because they are derived from the TNG photometry that is somewhat more noisy than the VLT photometry. The dashed line represents the model light curve for SN 2003dh, corresponding to the synthesis of 0.35 M⊙ of 56Ni, while the solid curve, which best reproduces the bolometric flux of SN 2013dx, was obtained by scaling down the above model curve by 25% and compressing it by 10%, which corresponds to a synthesized 56Ni mass of ~0.2 M⊙.
Current usage metrics show cumulative count of Article Views (full-text article views including HTML views, PDF and ePub downloads, according to the available data) and Abstracts Views on Vision4Press platform.
Data correspond to usage on the plateform after 2015. The current usage metrics is available 48-96 hours after online publication and is updated daily on week days.
Initial download of the metrics may take a while.