Fig. 5
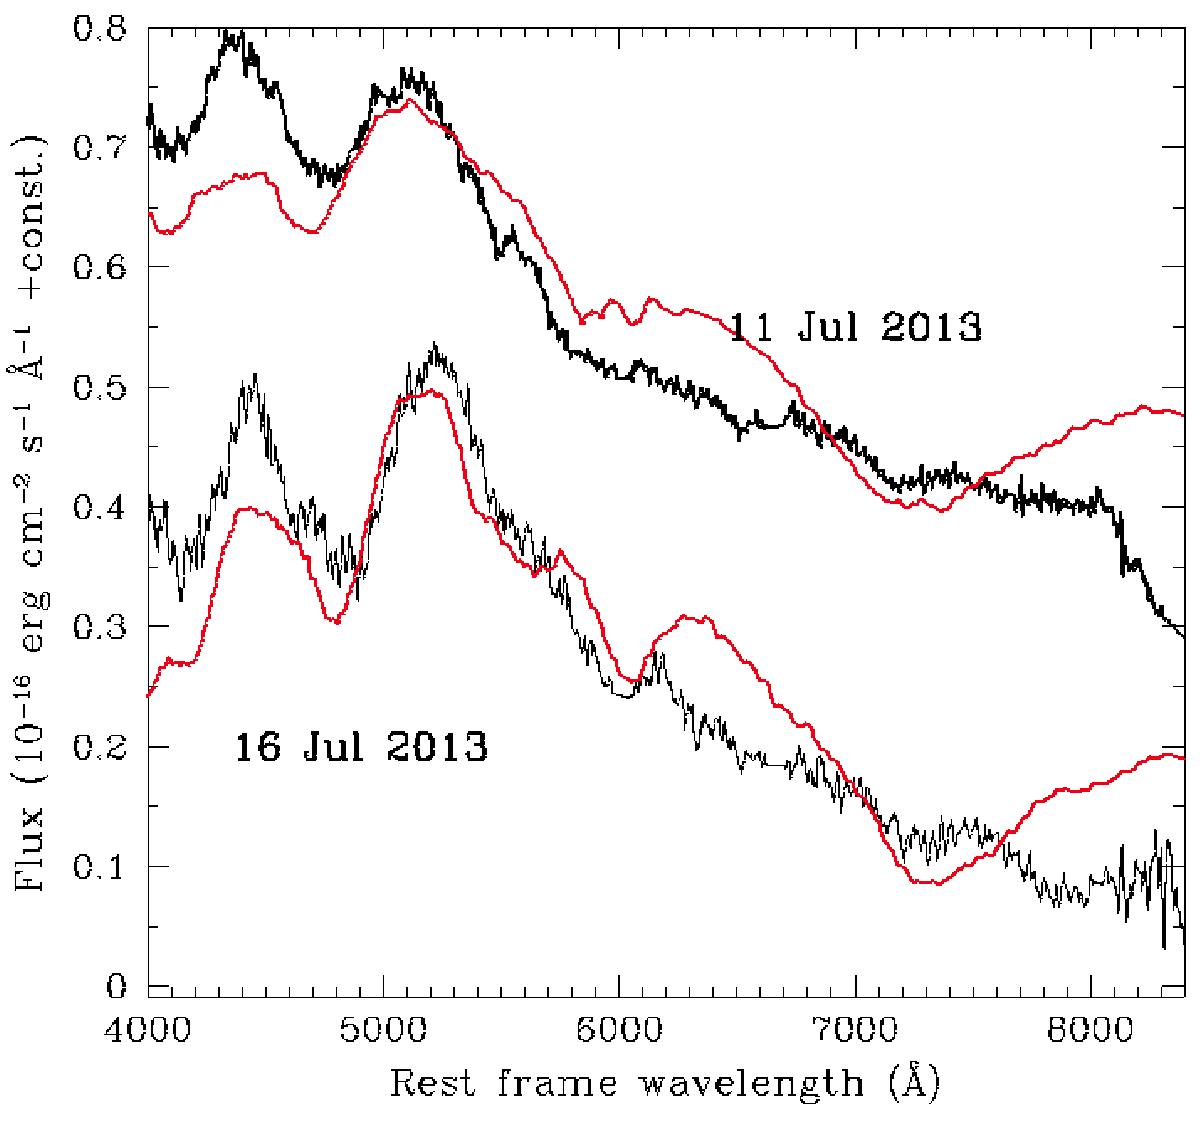
Spectra of SN2013dx (black) taken on 11 and 16 July 2013, in rest-frame. For comparison, the models of the two available spectra of SN2010ah, taken at comparable phases after SN explosion, are shown in red. As in Fig. 3, the Jul. 11 spectrum has been vertically shifted by 3 × 10-17 erg cm-2 s-1 Å-1 with respect that of Jul. 16.
Current usage metrics show cumulative count of Article Views (full-text article views including HTML views, PDF and ePub downloads, according to the available data) and Abstracts Views on Vision4Press platform.
Data correspond to usage on the plateform after 2015. The current usage metrics is available 48-96 hours after online publication and is updated daily on week days.
Initial download of the metrics may take a while.