Fig. 4
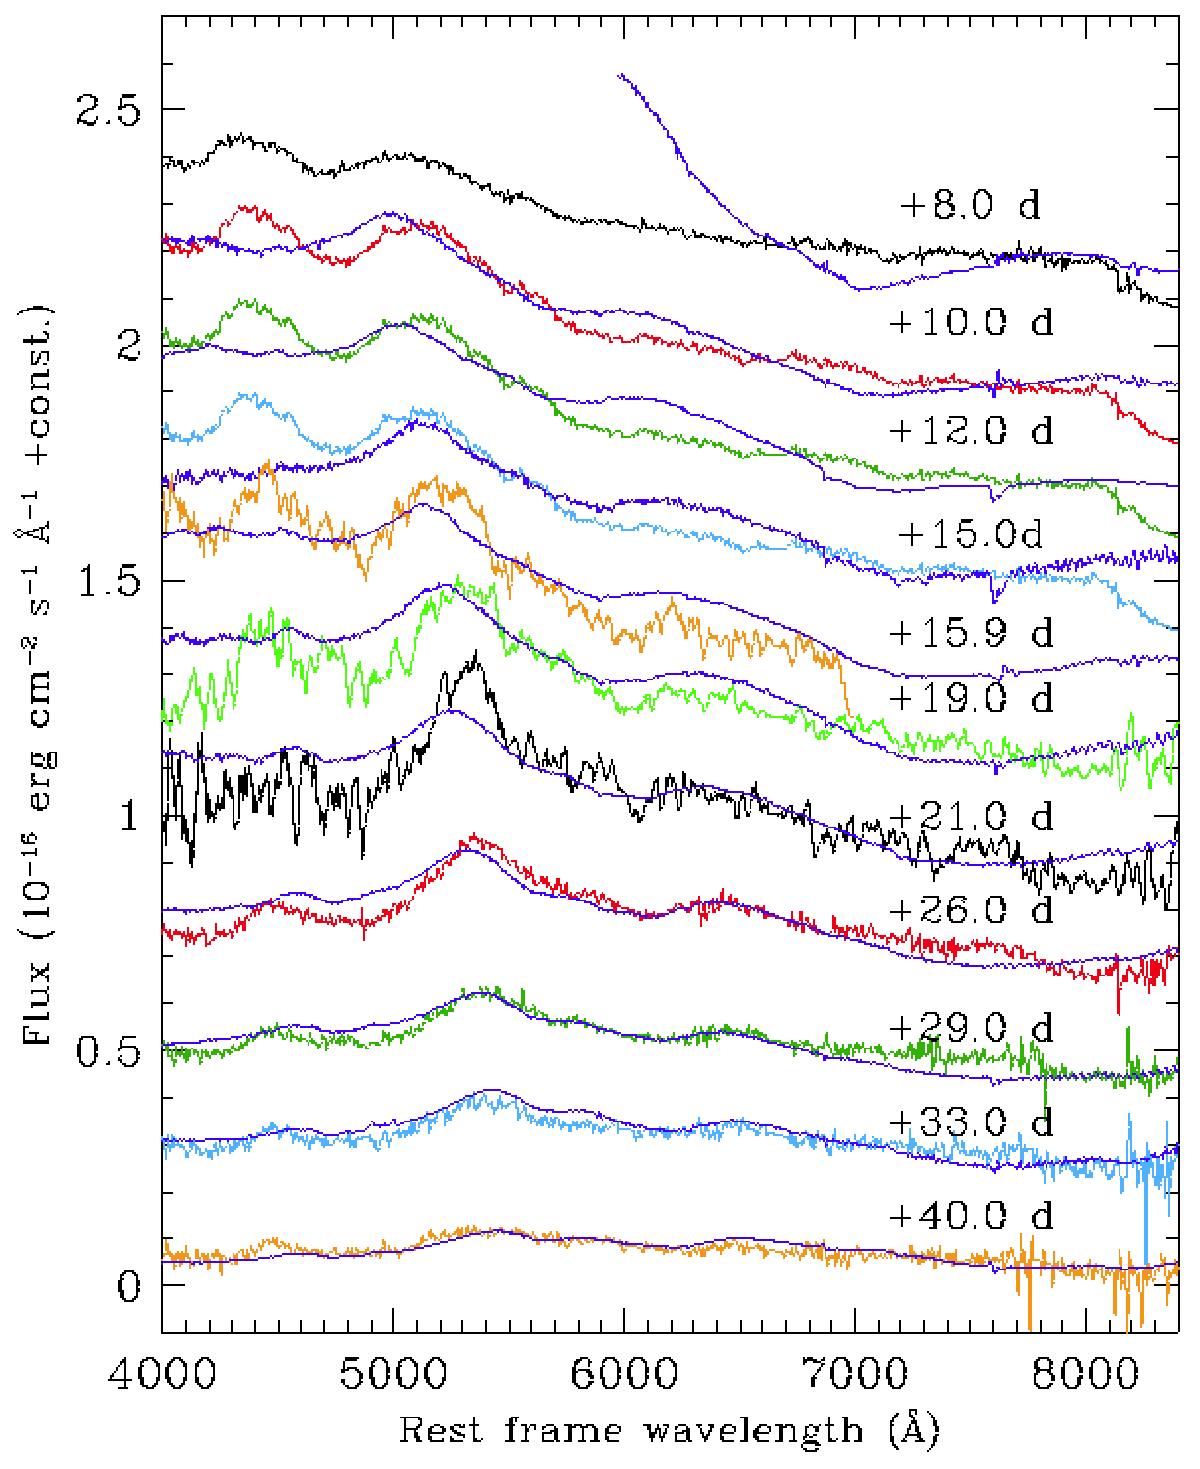
Eleven spectra of SN 2013dx (various colors) and 1998bw (blue only) at comparable rest-frame phases, marked in days with respect to the explosion time of GRB130702A. As in Fig. 3, the SN 2013dx spectra have been smoothed and vertically shifted by 2 × 10-17 erg cm-2 s-1 Å-1, with the earliest one at the top and the latest one, not shifted, at the bottom.
Current usage metrics show cumulative count of Article Views (full-text article views including HTML views, PDF and ePub downloads, according to the available data) and Abstracts Views on Vision4Press platform.
Data correspond to usage on the plateform after 2015. The current usage metrics is available 48-96 hours after online publication and is updated daily on week days.
Initial download of the metrics may take a while.