Fig. 7
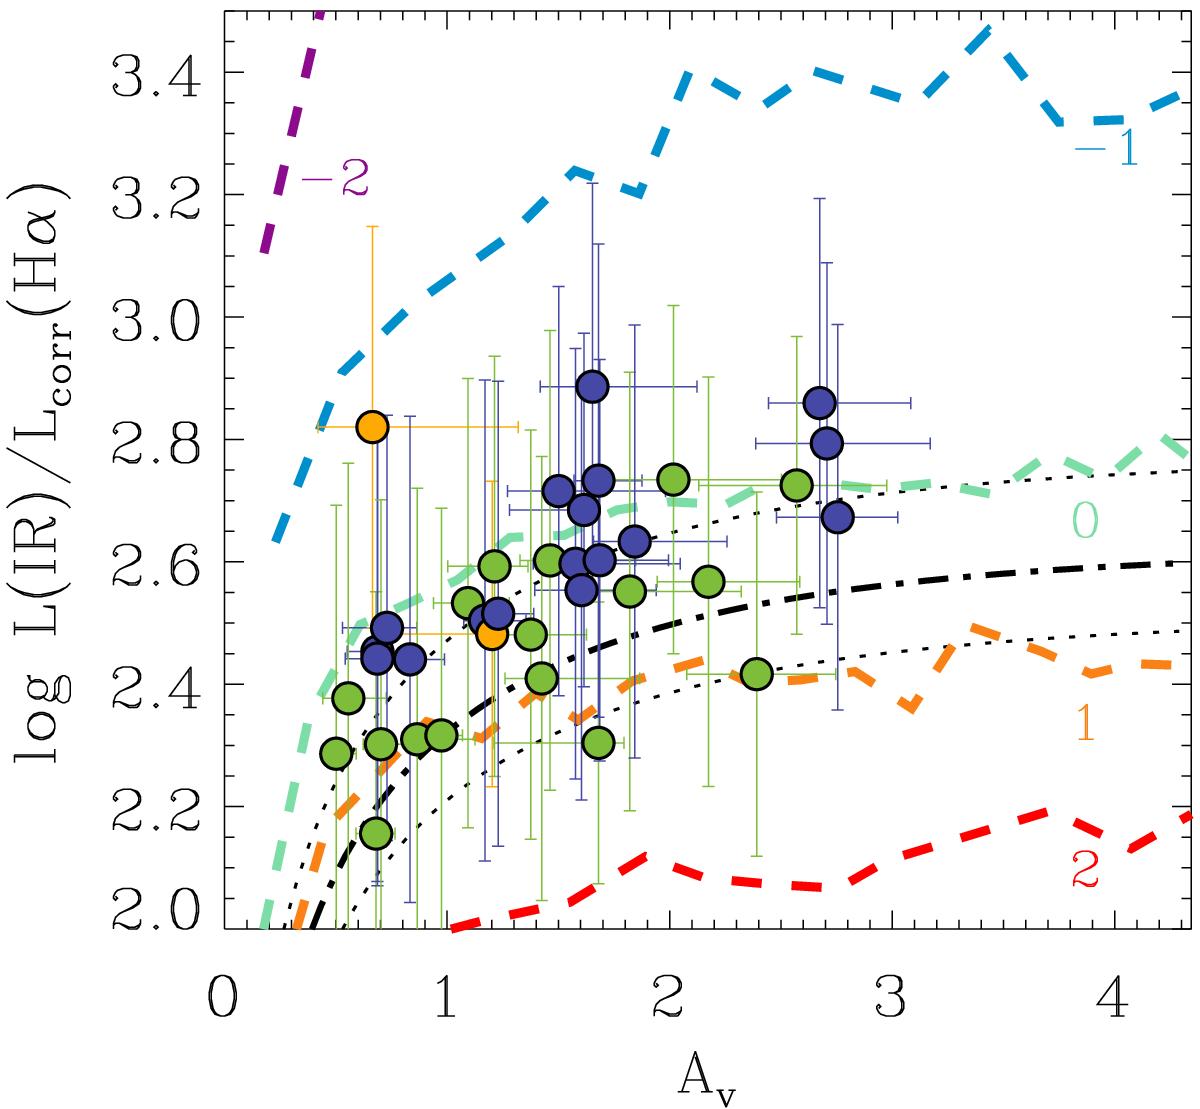
LIR/corrected Hα luminosity ratio as a function of the total extinction, Av. The dashed lines represent the expected ratio derived from our models for various log SFR1 − 10 Myr/SFR10 − 100 Myr values (red = 2, orange = 1, turquoise = 0, blue = –1, and purple = –2). The dot-dashed black line is the ratio calculated from empirical relation Lcorr(Hα) = Lobs(Hα) + 0.0024 LIR derived by Kennicutt et al. (2009) for a sample of nearby galaxies, and the dotted black lines are the uncertainty of that calibration. The contribution of the AGN torus to the IR luminosity has been subtracted when present. The color of the symbols is as in Fig. 4.
Current usage metrics show cumulative count of Article Views (full-text article views including HTML views, PDF and ePub downloads, according to the available data) and Abstracts Views on Vision4Press platform.
Data correspond to usage on the plateform after 2015. The current usage metrics is available 48-96 hours after online publication and is updated daily on week days.
Initial download of the metrics may take a while.