Fig. 6
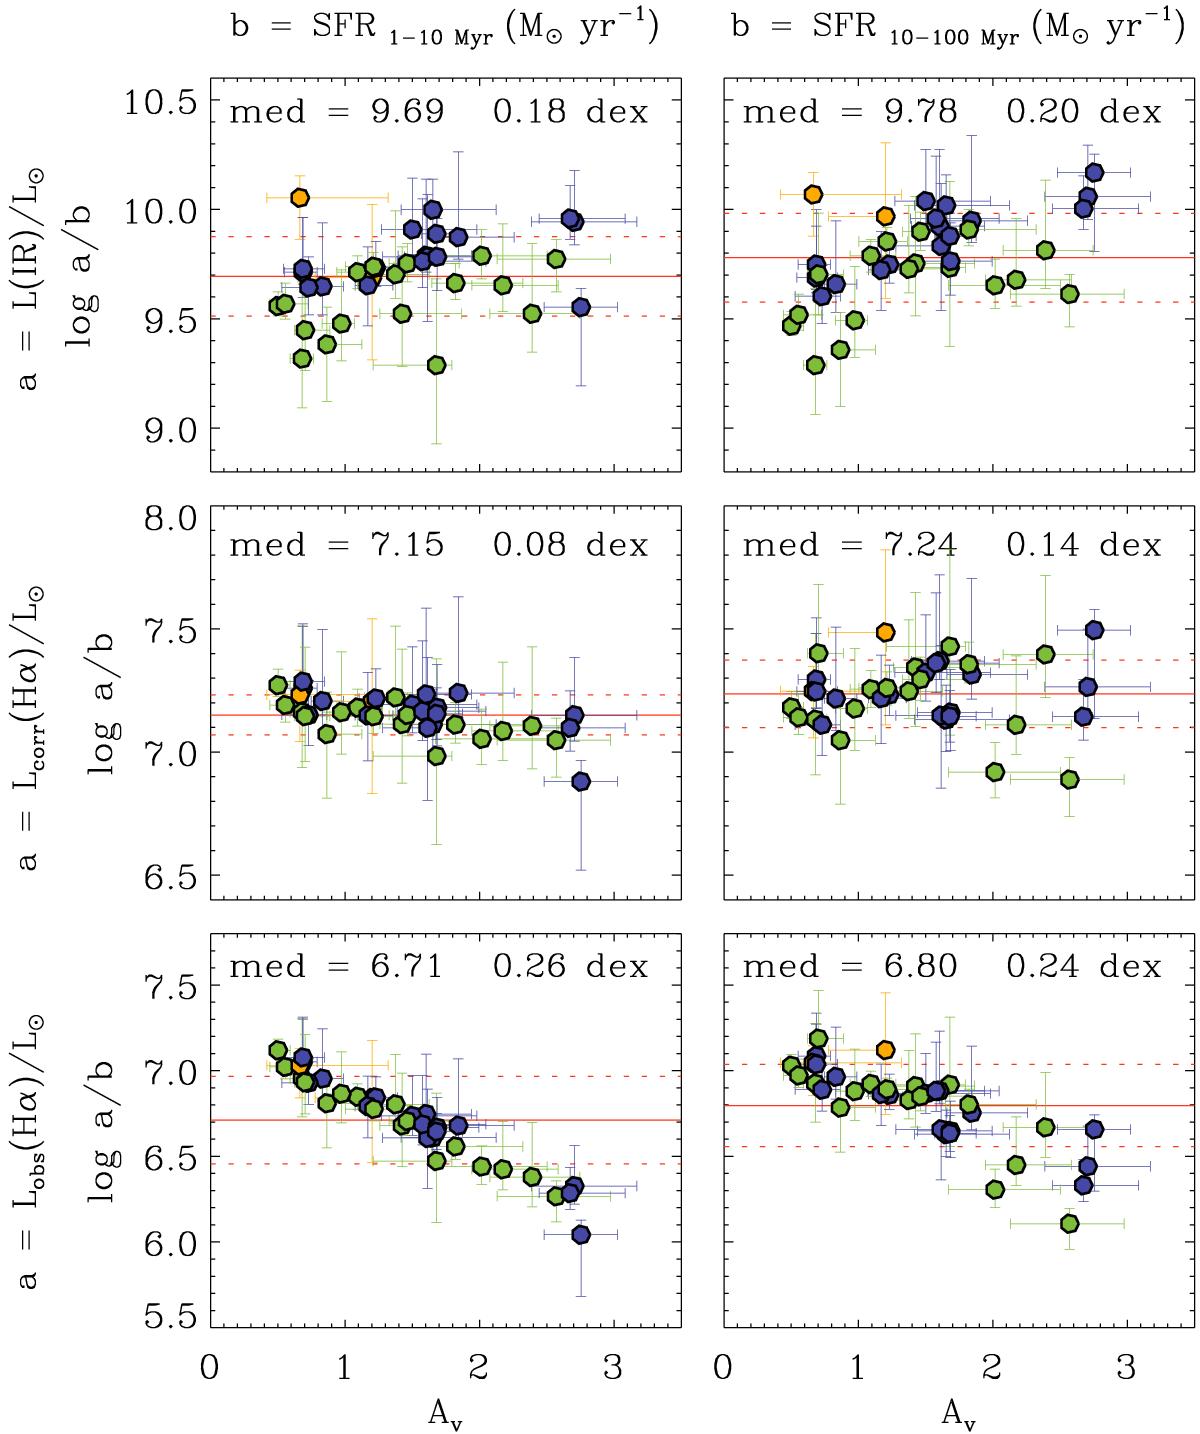
IR and Hα luminosity/SFR ratio as a function of the fitted total extinction, Av considering the 1−10 and 10−100 Myr to average the SFR. The median ratio (solid red line) and the scatter (dashed red line) are indicated in each plot. The contribution of the AGN torus has been subtracted when present. The color of the symbols is as in Fig. 4.
Current usage metrics show cumulative count of Article Views (full-text article views including HTML views, PDF and ePub downloads, according to the available data) and Abstracts Views on Vision4Press platform.
Data correspond to usage on the plateform after 2015. The current usage metrics is available 48-96 hours after online publication and is updated daily on week days.
Initial download of the metrics may take a while.