Fig. 4
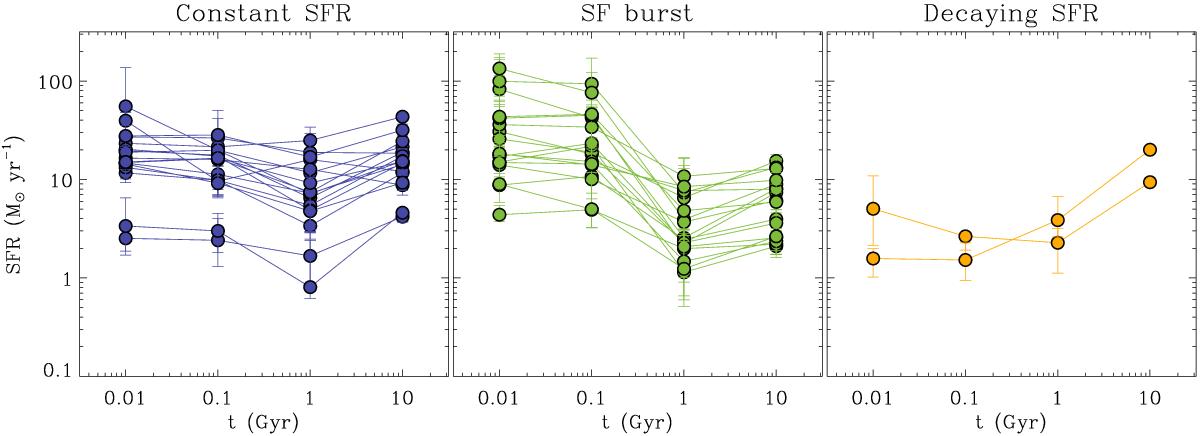
Star-formation histories derived from the SED fitting. In the left panel we show the SFH of those galaxies with a constant SFH in blue. In the central panel, we plot those SFH with a recent burst of SF (green). In the right panel we show those SFH with a decaying SFR (orange).
Current usage metrics show cumulative count of Article Views (full-text article views including HTML views, PDF and ePub downloads, according to the available data) and Abstracts Views on Vision4Press platform.
Data correspond to usage on the plateform after 2015. The current usage metrics is available 48-96 hours after online publication and is updated daily on week days.
Initial download of the metrics may take a while.