Fig. 2
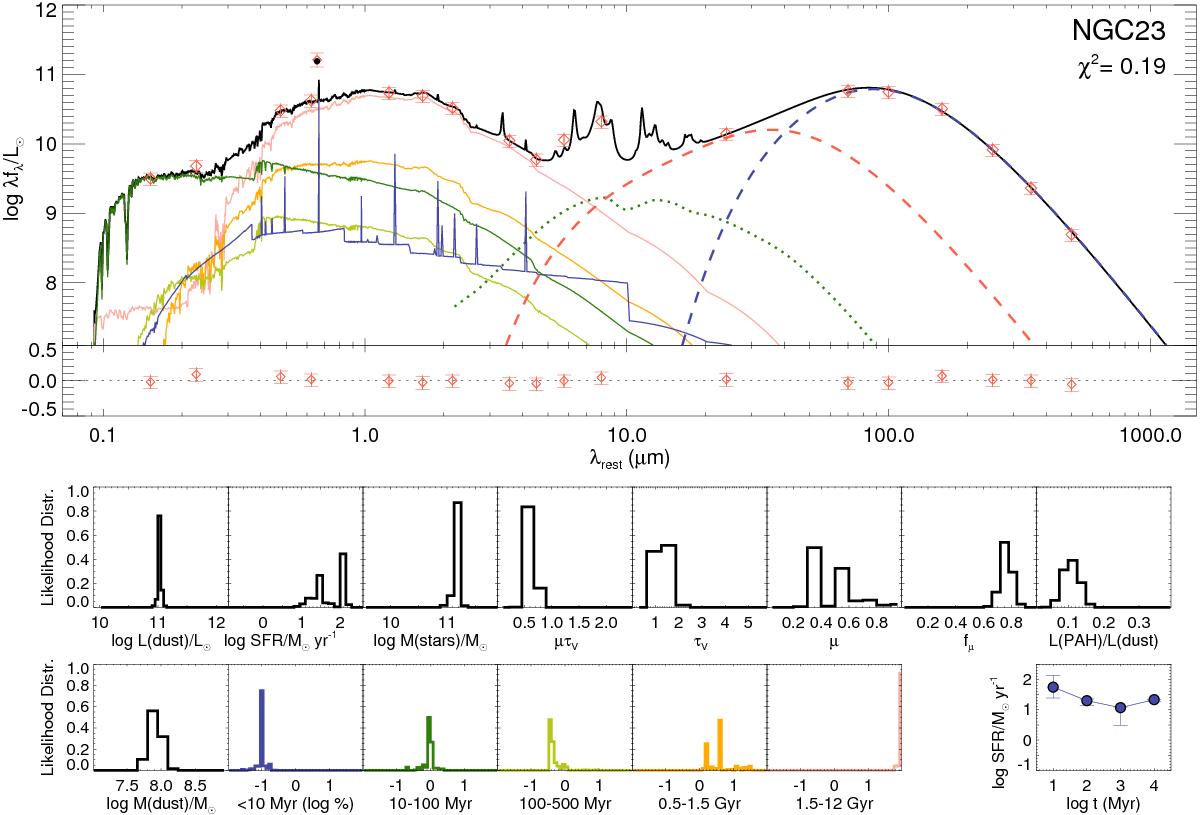
Top panel: best-fitting model for the SED of NGC 23 (constant SFH, see Sect. 5.1) in a solid black line, together with the observed data (red diamonds). The Hα luminosity and model prediction in L⊙ units are plotted at λ = 6563 Å (red diamond and solid black circle, respectively) multiplied by a factor of 103. The solid color lines indicate the contribution of the different stellar populations with ages <10 Myr (blue), 10−100 Myr (dark green), 100–500 Myr (light green), 0.5–1.5 Gyr (orange), and > 1.5 Gyr (pink). The blue and red dashed lines are the dust emission for dust temperatures lower and higher than 50 K, respectively. The dotted green line is the AGN torus model derived by Alonso-Herrero et al. (2012a). The residuals are shown in the lower part of the panel. Bottom panels: likelihood distribution for several of the physical parameters (IR dust luminosity, SFR, stellar mass, ISM extinction μτv, young stars extinction τv, ratio between the ISM and young stars extinctions μ, fraction of IR luminosity produced by cold dust with T< 50 K removing the AGN contribution fμ, fraction of IR luminosity due to PAH emission, and dust mass). The next five panels show the logarithm of the percentage of the stellar mass for different stellar age ranges using the same color coding as in the top panel. The last panel represents the SFH.
Current usage metrics show cumulative count of Article Views (full-text article views including HTML views, PDF and ePub downloads, according to the available data) and Abstracts Views on Vision4Press platform.
Data correspond to usage on the plateform after 2015. The current usage metrics is available 48-96 hours after online publication and is updated daily on week days.
Initial download of the metrics may take a while.