Fig. 1
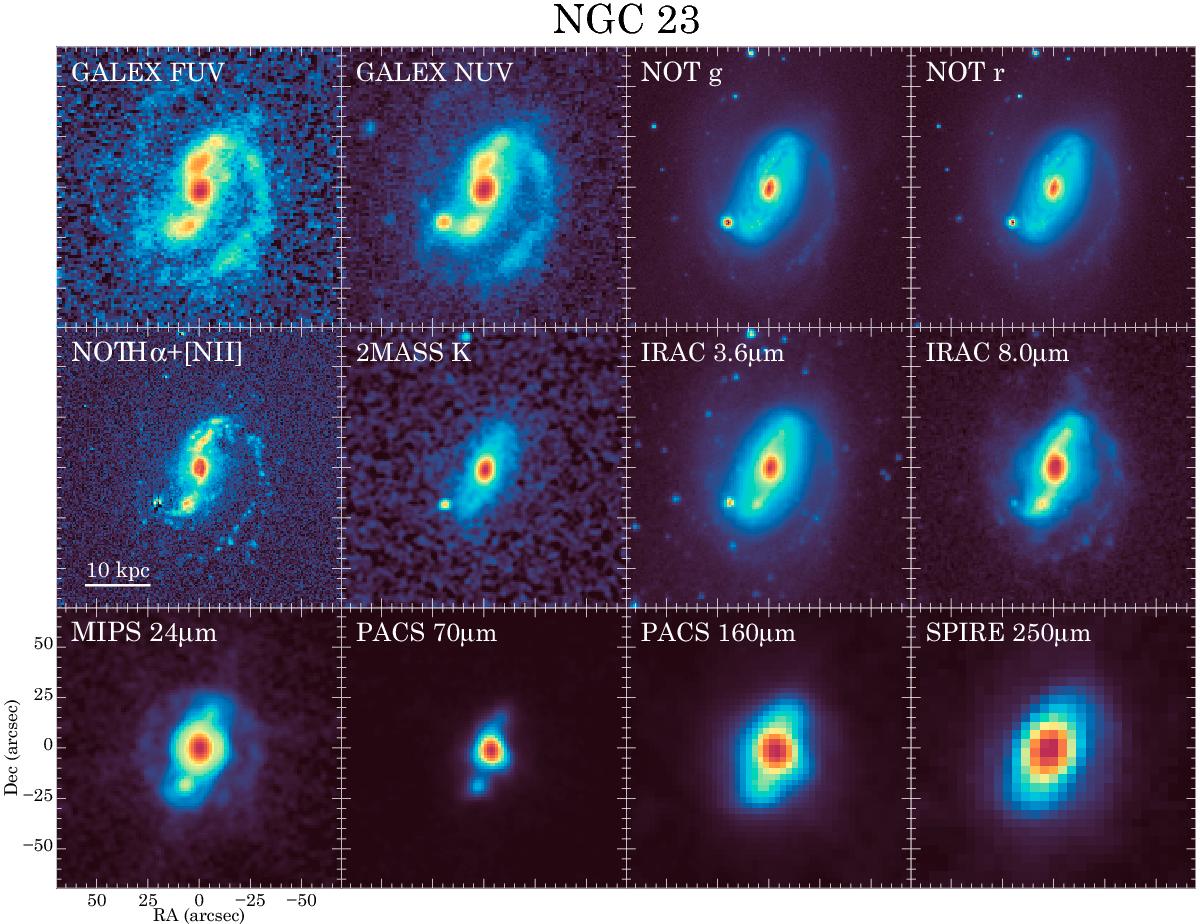
Subset of the images used to construct the integrated SED of NGC 23. The new NOT optical observations of the g, r, and Hα+[N ii] bands are shown. The rest of the images were obtained from the public archives of their respective observatories (see Sect. 3 for details). Some images used in the SED are not displayed here because they have morphologies similar to those of the presented images (2MASS J and H, IRAC 4.5 and 5.8 μm, and PACS 100 μm) or because they have a very low angular resolution (SPIRE 350 and 500 μm). All images are shown in a logarithm scale. North is up and east to the left. The white bar in the Hα+[N ii] panel represents 10 kpc at the distance of the object.
Current usage metrics show cumulative count of Article Views (full-text article views including HTML views, PDF and ePub downloads, according to the available data) and Abstracts Views on Vision4Press platform.
Data correspond to usage on the plateform after 2015. The current usage metrics is available 48-96 hours after online publication and is updated daily on week days.
Initial download of the metrics may take a while.