Free Access
Fig. 9
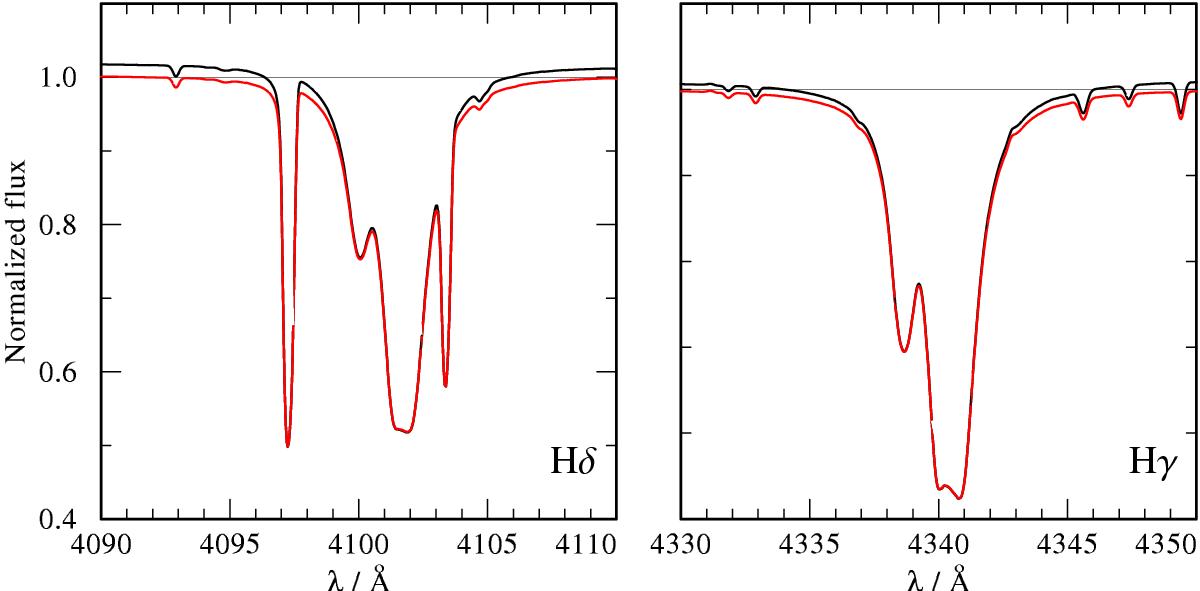
Line profiles of Hγ and Hδ for the same supergiant PoWR model. The red line denotes the spectrum that is obtained when switching off the electron redistribution in the formal integral, while the black line indicates the “normal” output, which includes the redistribution of free electrons.
Current usage metrics show cumulative count of Article Views (full-text article views including HTML views, PDF and ePub downloads, according to the available data) and Abstracts Views on Vision4Press platform.
Data correspond to usage on the plateform after 2015. The current usage metrics is available 48-96 hours after online publication and is updated daily on week days.
Initial download of the metrics may take a while.