Fig. 4
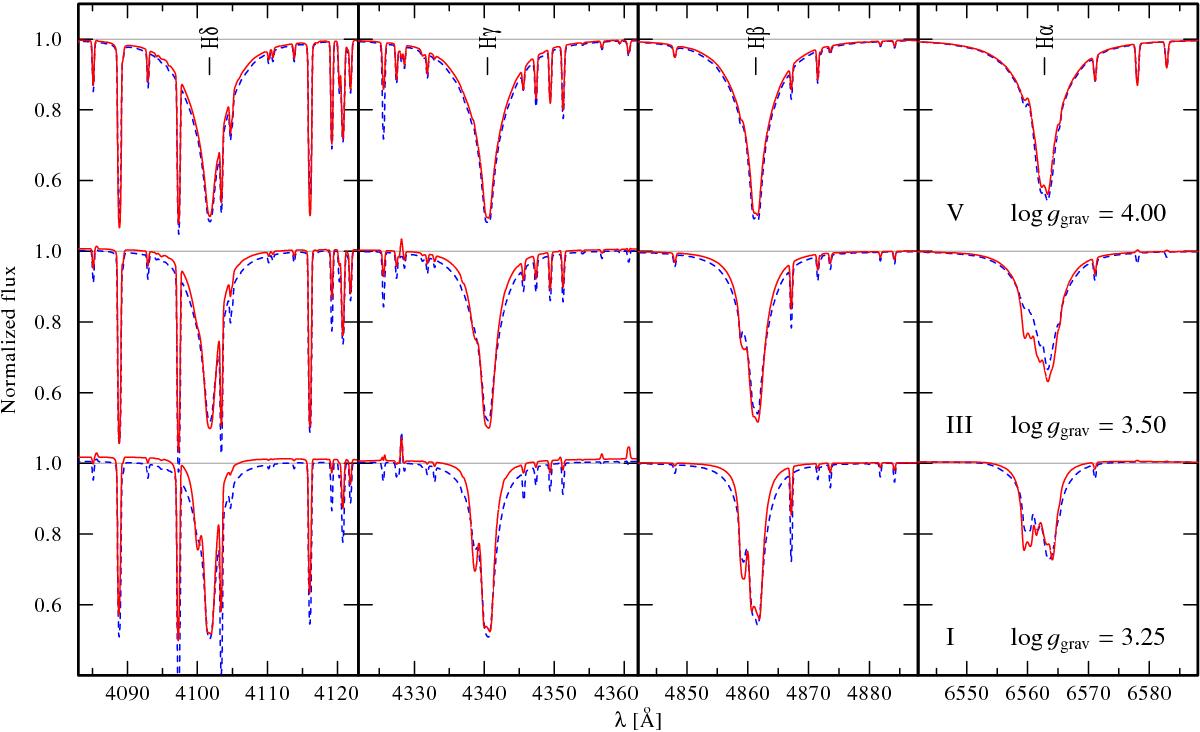
Balmer line profiles of Hδ (left) to Hα (right) for test models with fixed ggrav. The spectra from the (a)-type models with a quasi-hydrostatic stratification calculated using only the Thomson term Γe are shown as blue dashed line. The red solid lines display the profiles from the (b)-type models accounting for the full radiative term Γrad.
Current usage metrics show cumulative count of Article Views (full-text article views including HTML views, PDF and ePub downloads, according to the available data) and Abstracts Views on Vision4Press platform.
Data correspond to usage on the plateform after 2015. The current usage metrics is available 48-96 hours after online publication and is updated daily on week days.
Initial download of the metrics may take a while.