Fig. 1
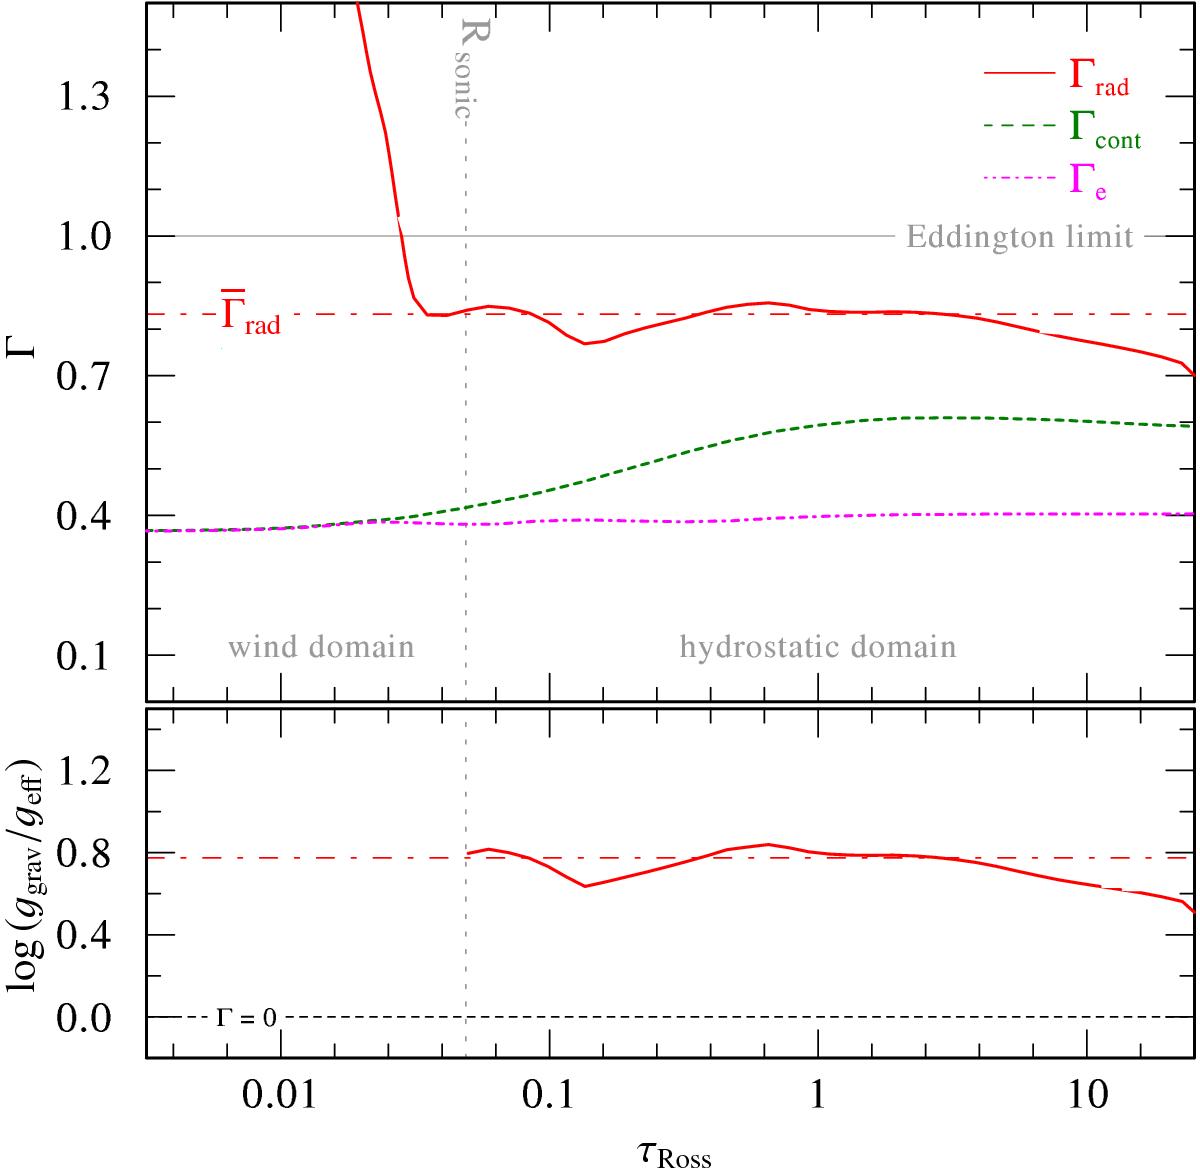
Radial dependence of Γrad (red, solid line, upper panel) for our supergiant test model, plotted over the Rosseland optical depth τRoss. The mean value obtained with Eq. (29) is indicated as a dashed-dotted line. For comparison, Γe and the total continuum contribution Γcont are also shown. Lower panel: difference between ggrav and geff is illustrated: the red solid curve marks the actual difference at each optical depth, while the dashed-dotted line denotes the difference using ![]() . The gray dashed vertical line denotes the location of the sonic point.
. The gray dashed vertical line denotes the location of the sonic point.
Current usage metrics show cumulative count of Article Views (full-text article views including HTML views, PDF and ePub downloads, according to the available data) and Abstracts Views on Vision4Press platform.
Data correspond to usage on the plateform after 2015. The current usage metrics is available 48-96 hours after online publication and is updated daily on week days.
Initial download of the metrics may take a while.