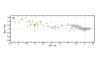
Fig. 6
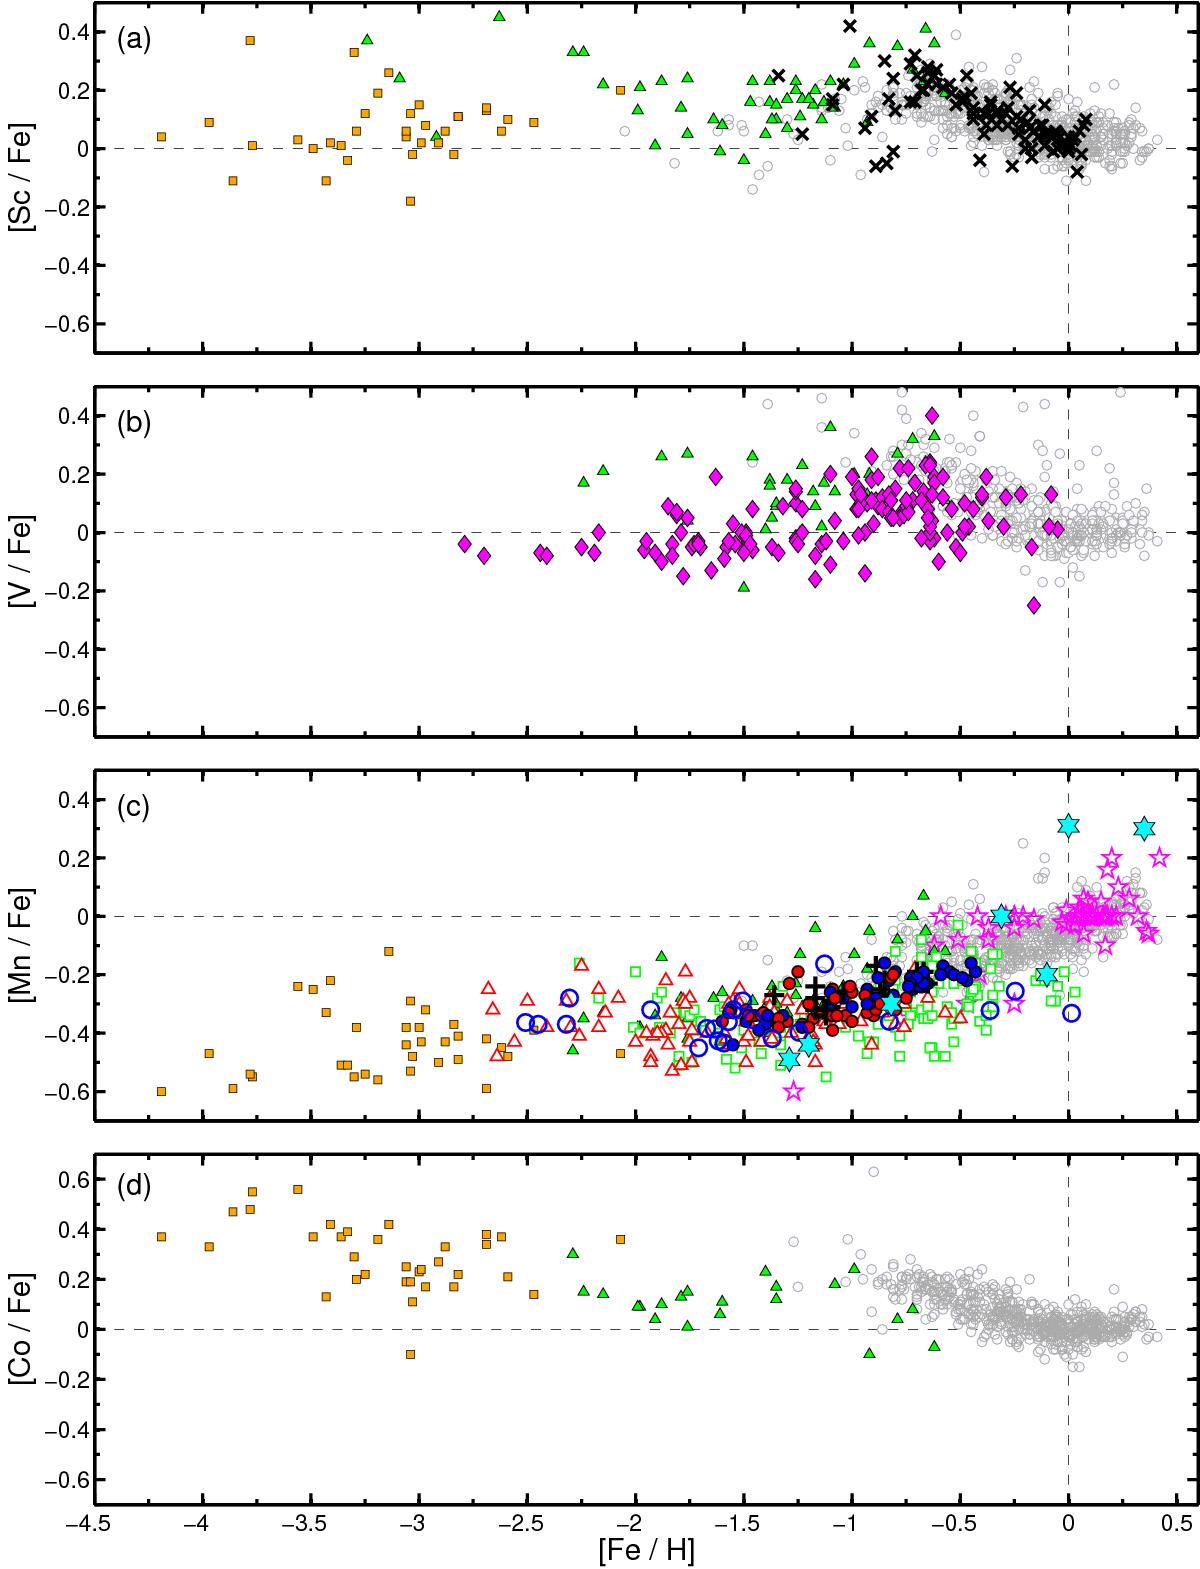
Galactic trends with data from the literature with gray dots showing our results for the Galactic disk. In panel a) for Sc with data from Ishigaki et al. (2013; green filled triangles) and Nissen et al. (2000; black crosses) dwarfs from thick disk and halo, and metal-poor giants from Cayrel et al. (2004; orange squares). In b) V green filled triangles as in panel a) and magenta filled diamonds from Fulbright (2000) from galactic halo. Panel c) shows the trends for Mn, with orange squares and green filled triangles as before. In addition, Nissen & Schuster (2011) thick disk stars (black crosses), high α population (blue filled dots), and low α population (red filled dots), Barbuy et al. (2013; magenta stars), and McWilliam et al. (2003; cyan six-pointed stars) from the bulge and Sobeck et al. (2006) from globular clusters (blue circles) and Sobeck et al. (2006) from field stars using stars from Fulbright (2000; green squares) and Simmerer et al. (2004; red triangles). In d) Co trend for Ishigaki et al. (2013; green filled triangles) and Cayrel et al. (2004; orange squares).
Current usage metrics show cumulative count of Article Views (full-text article views including HTML views, PDF and ePub downloads, according to the available data) and Abstracts Views on Vision4Press platform.
Data correspond to usage on the plateform after 2015. The current usage metrics is available 48-96 hours after online publication and is updated daily on week days.
Initial download of the metrics may take a while.