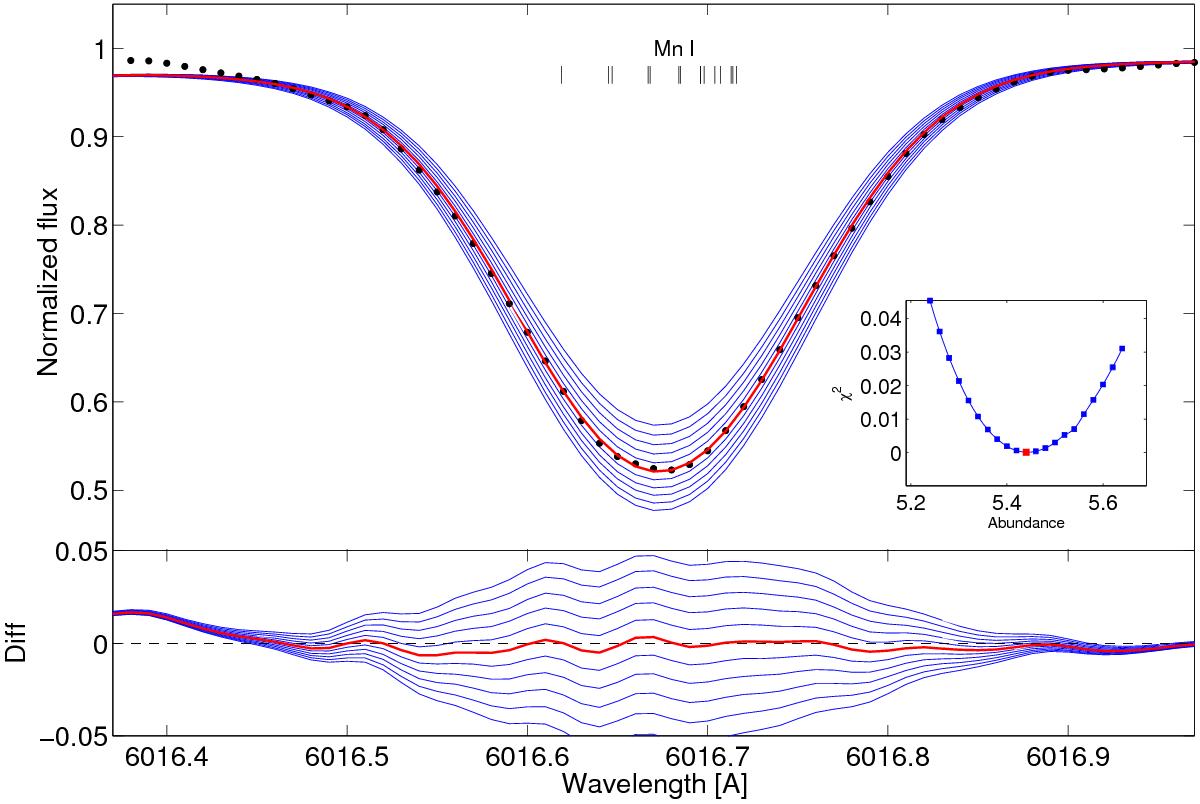
Fig. 1

Example of a well-fitted line in the case of solar spectrum for the Mn i line at 6016 Å. Upper panel: eleven synthetic spectra with different abundances in steps of 0.04 dex (blue lines). The positions of the hyperfine components are indicated at the top. The difference between the observed spectrum and the synthetic spectra is plotted in the lower panel with the best abundance spectrum plotted as a red line in both the upper and lower panel. The inset presents the χ2 fit to determine the best abundance value expressed as log ϵX (shown as a red dot); the 22 blue dots are the χ2 values for all the spectra created by SME.
Current usage metrics show cumulative count of Article Views (full-text article views including HTML views, PDF and ePub downloads, according to the available data) and Abstracts Views on Vision4Press platform.
Data correspond to usage on the plateform after 2015. The current usage metrics is available 48-96 hours after online publication and is updated daily on week days.
Initial download of the metrics may take a while.


