Free Access
Fig. 3
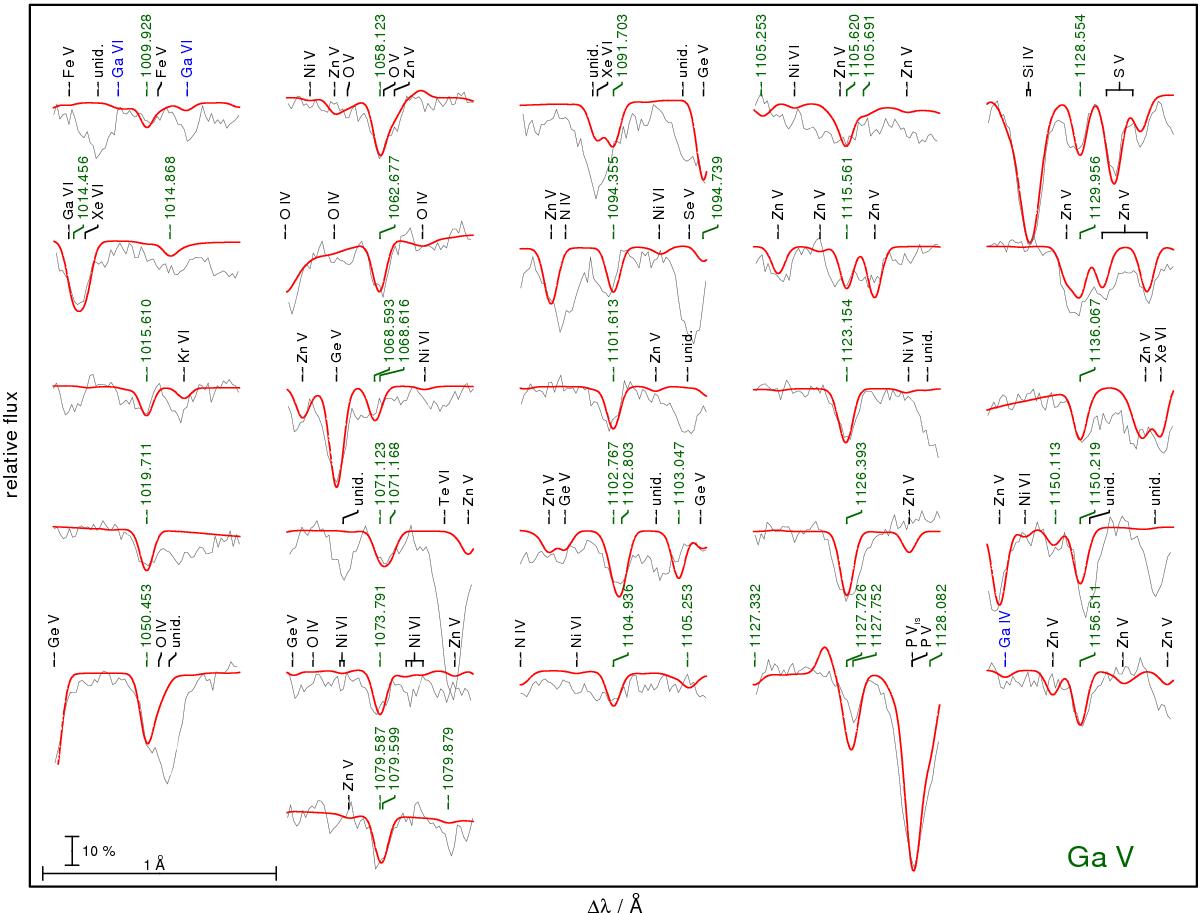
Strongest Ga v lines in the FUSE observation of RE 0503−289, labeled (green in the online version) with their wavelengths from Table 8. The vertical bar indicates 10 % of the continuum flux. Identified lines are marked. “unid.” denotes unidentified, “is” interstellar.
Current usage metrics show cumulative count of Article Views (full-text article views including HTML views, PDF and ePub downloads, according to the available data) and Abstracts Views on Vision4Press platform.
Data correspond to usage on the plateform after 2015. The current usage metrics is available 48-96 hours after online publication and is updated daily on week days.
Initial download of the metrics may take a while.