Fig. 9
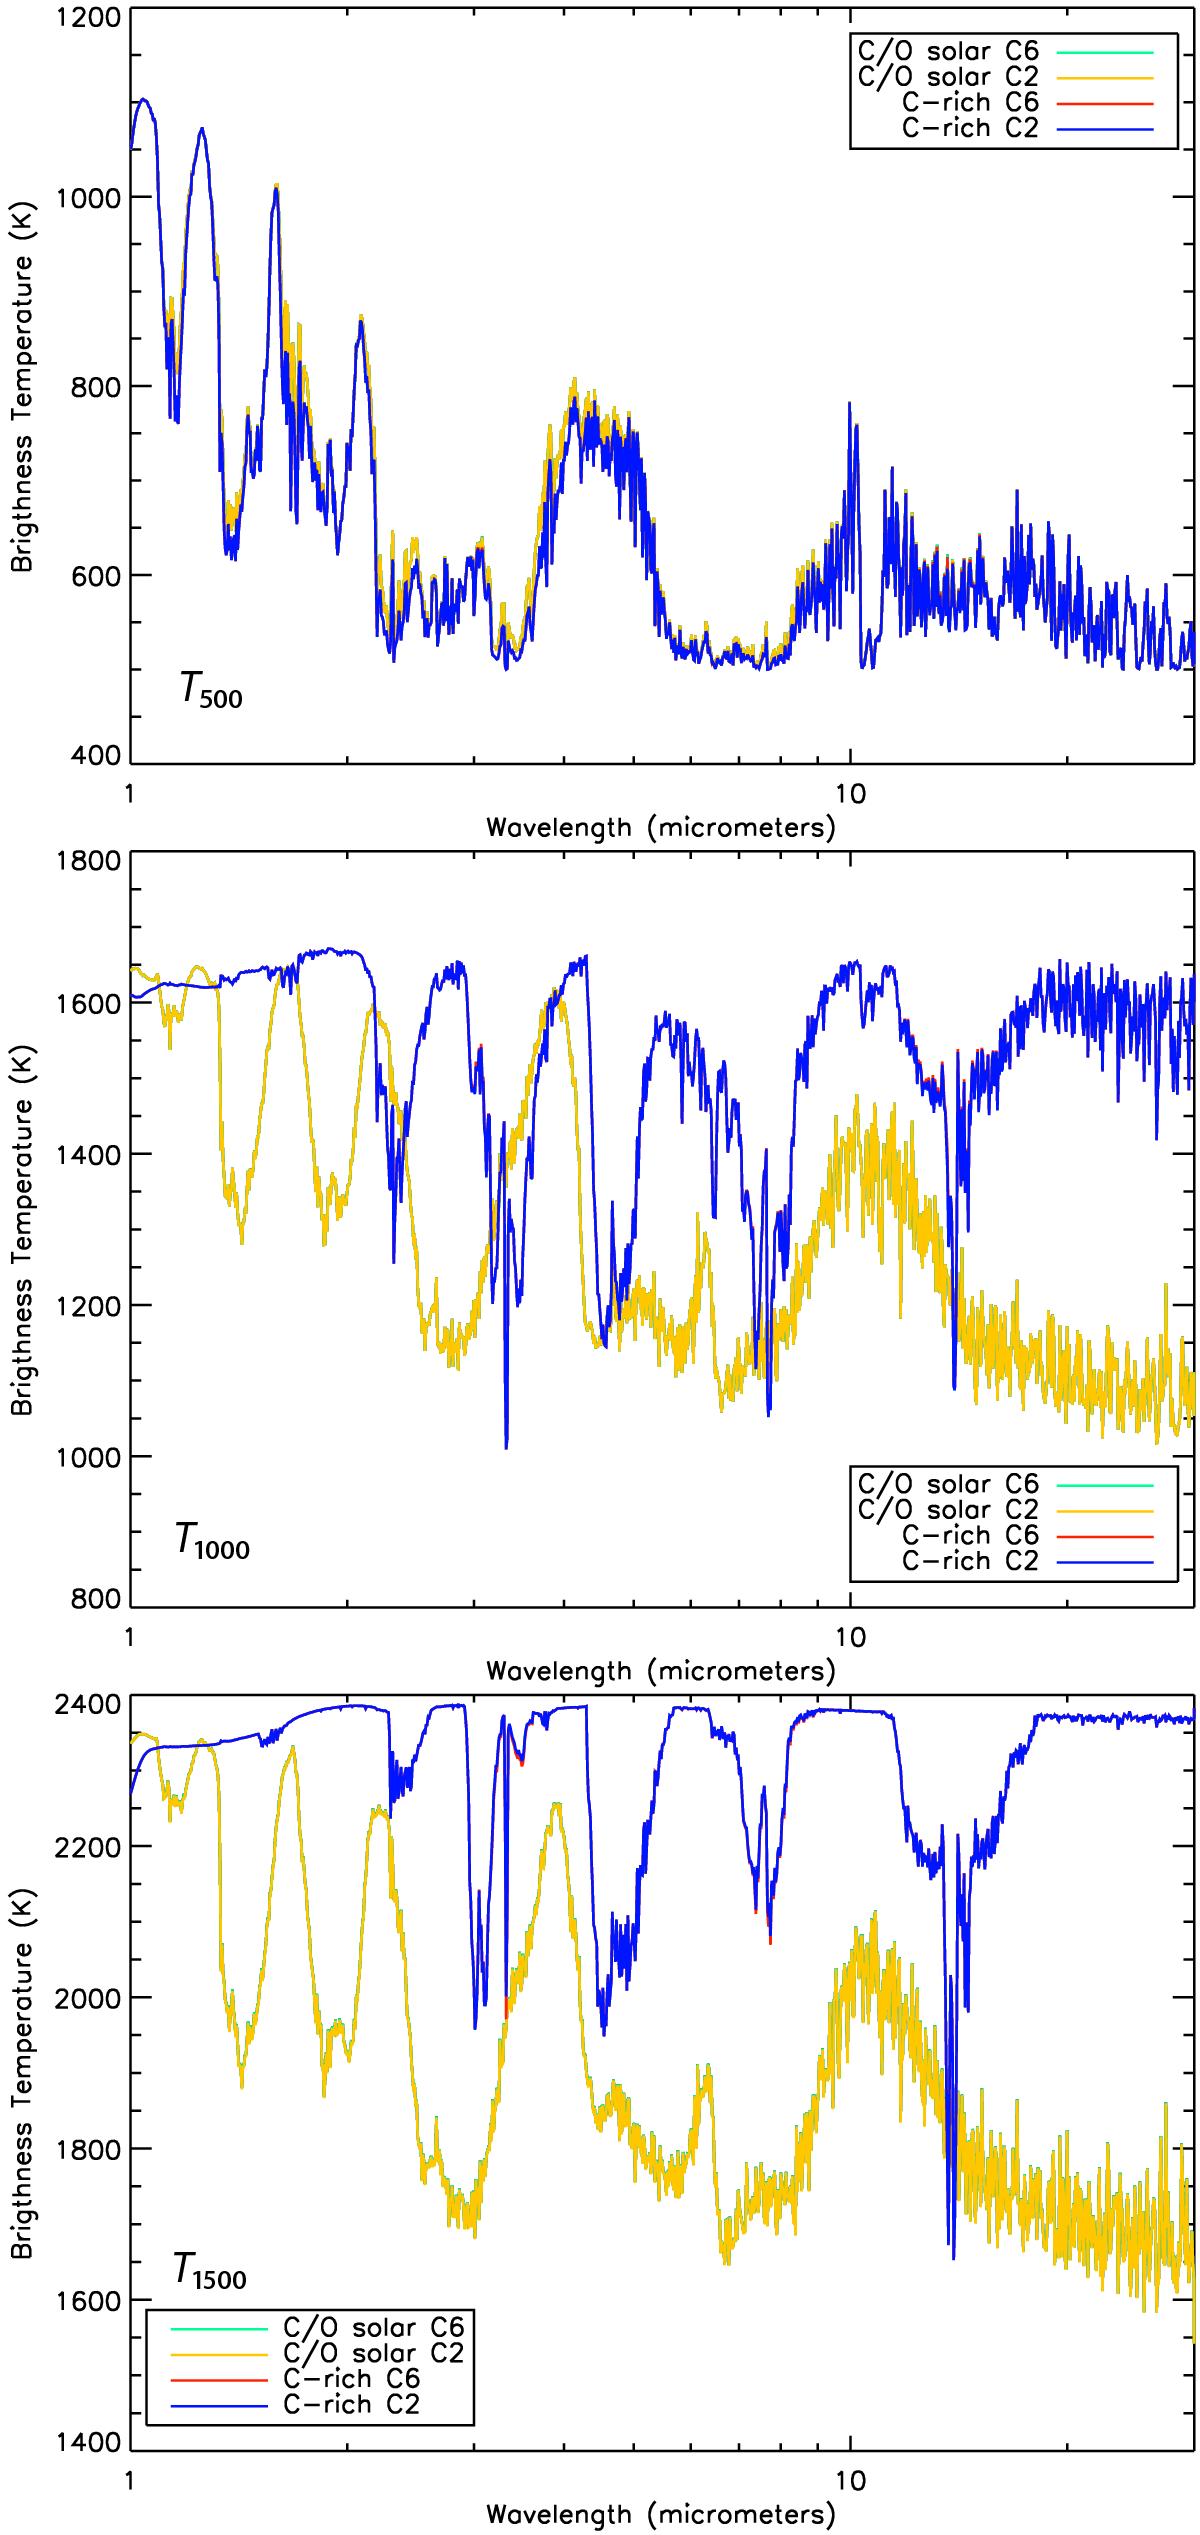
Synthetic emission spectra corresponding to the three thermal profiles T500 (up), T1000 (middle), and T1500 (bottom), represented by the brightness temperature (K). For each thermal profile, spectra have been calculated with the atmospheric compositions found with the C0-C2 and C0-C6 schemes for the cases C/O = solar and C/O = 1.1, as labelled in each figure.
Current usage metrics show cumulative count of Article Views (full-text article views including HTML views, PDF and ePub downloads, according to the available data) and Abstracts Views on Vision4Press platform.
Data correspond to usage on the plateform after 2015. The current usage metrics is available 48-96 hours after online publication and is updated daily on week days.
Initial download of the metrics may take a while.