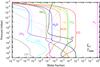
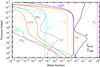
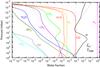
Fig. 3
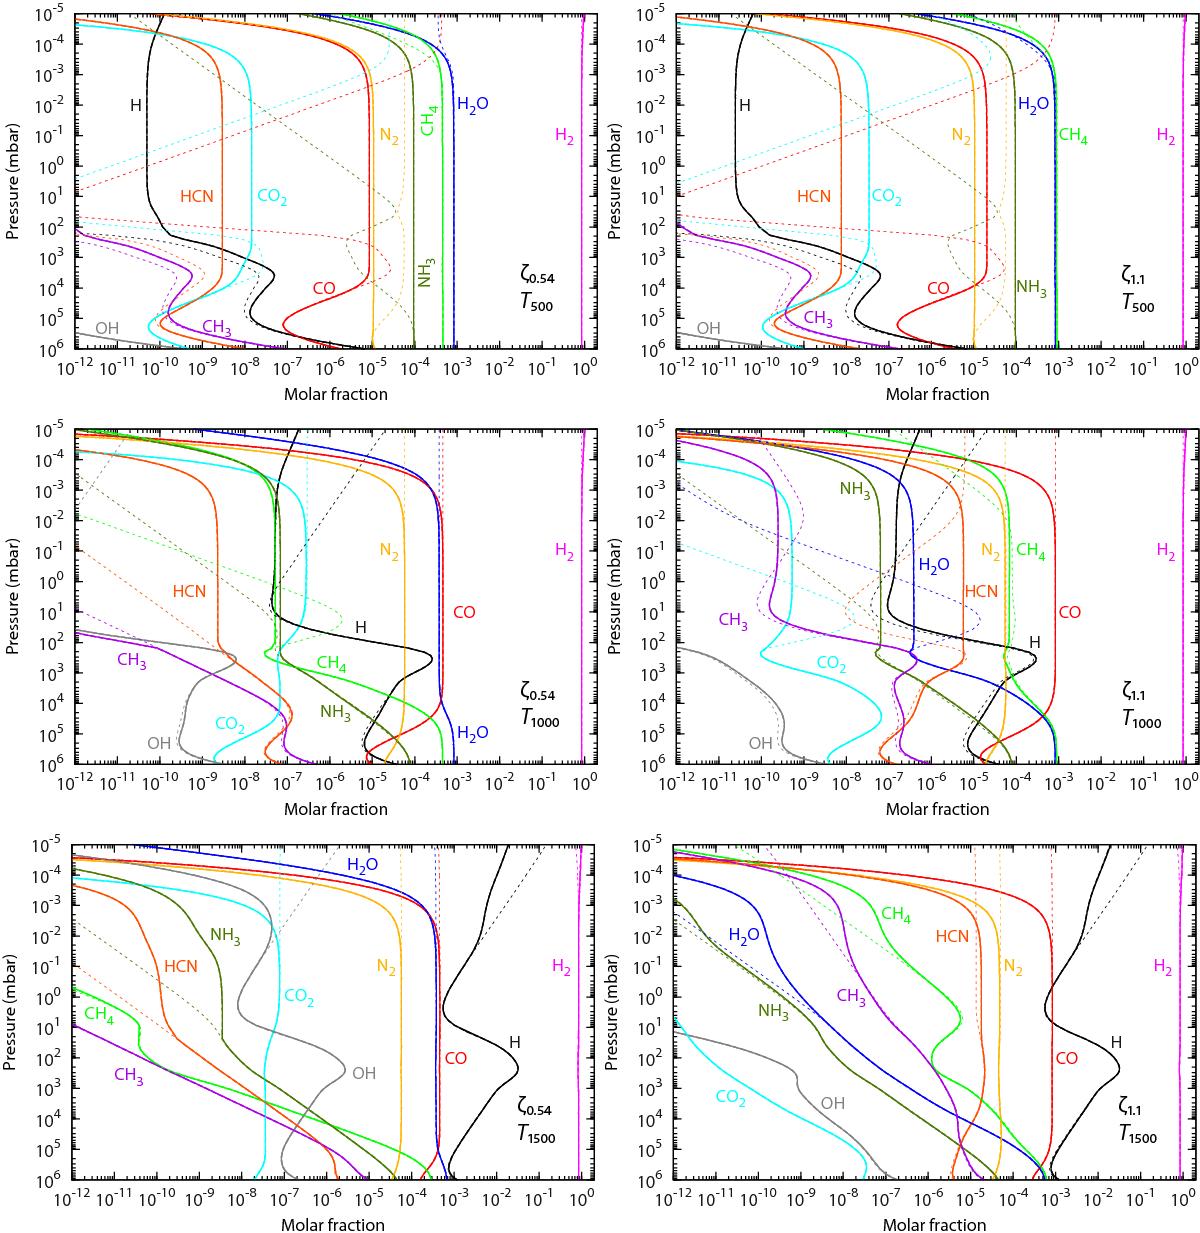
Vertical abundance profiles for the cool (up), warm (middle), and hot (bottom) thermal profiles, with the C/O ratio solar (left) and C/O = 1.1 (right). The chemical compositions are calculated with the C0-C2 scheme (dashed line) and the C0-C6 scheme (solid line), without photodissociation. Dashed and solid lines overlap, so that the dashed lines are obscured. The chemical equilibrium (dotted line) is also represented.
Current usage metrics show cumulative count of Article Views (full-text article views including HTML views, PDF and ePub downloads, according to the available data) and Abstracts Views on Vision4Press platform.
Data correspond to usage on the plateform after 2015. The current usage metrics is available 48-96 hours after online publication and is updated daily on week days.
Initial download of the metrics may take a while.