Fig. 8
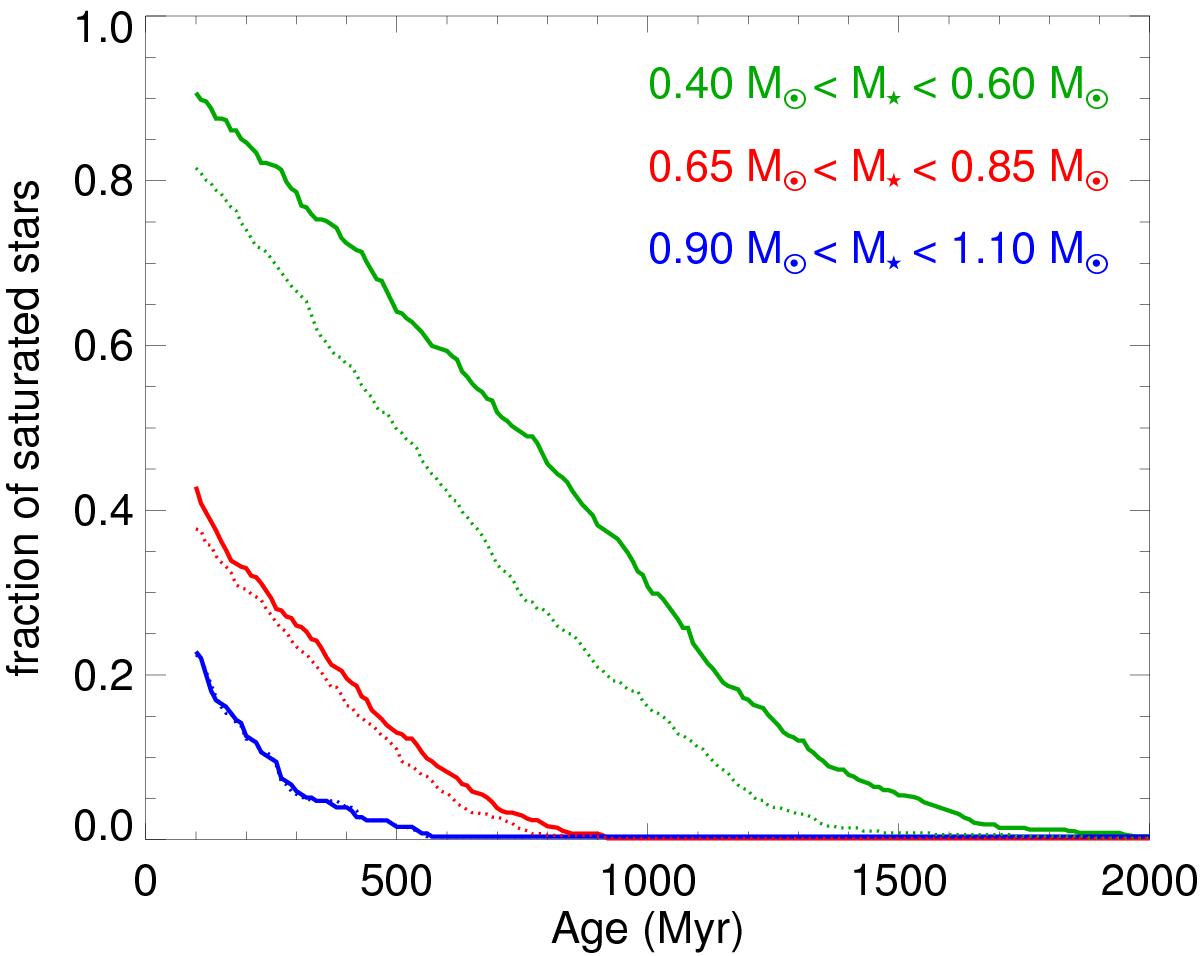
Fraction of stars in the saturated regime as a function of age based on the results shown in Fig. 7 for different mass bins. The solid lines correspond to the values calculated using our constraints on the mass dependence of the saturation threshold given by Eq. (6) with c = 2.3, and the dotted lines show the values calculated using the empirical saturation threshold for X-ray emission derived by Wright et al. (2011).
Current usage metrics show cumulative count of Article Views (full-text article views including HTML views, PDF and ePub downloads, according to the available data) and Abstracts Views on Vision4Press platform.
Data correspond to usage on the plateform after 2015. The current usage metrics is available 48-96 hours after online publication and is updated daily on week days.
Initial download of the metrics may take a while.