Fig. 6
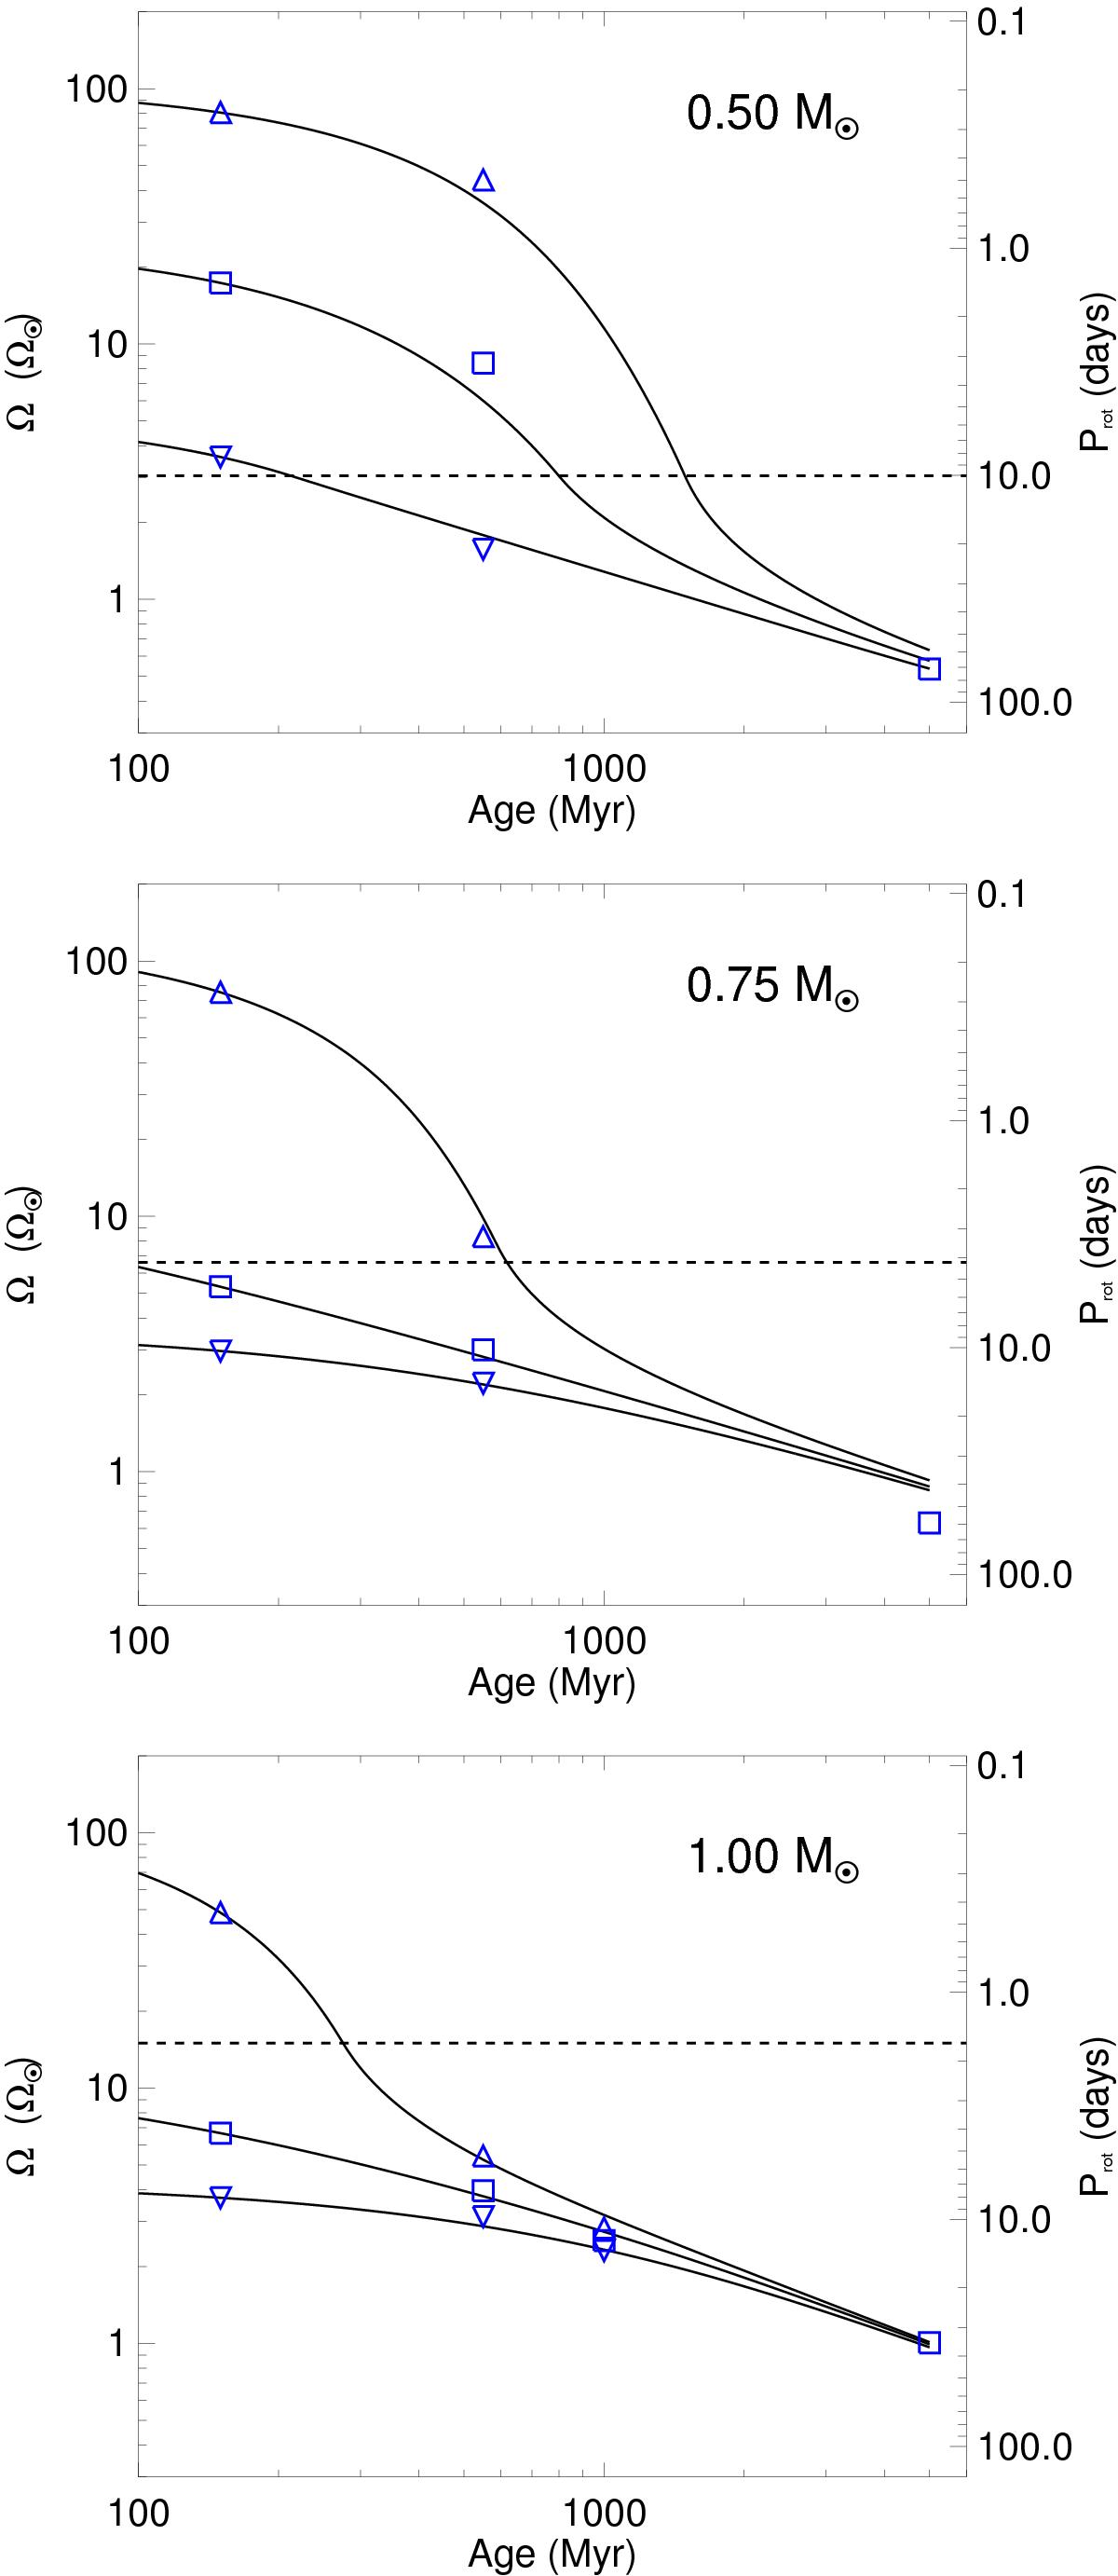
Rotational evolution of stars at the 10th, 50th, and 90th percentiles of the rotational distribution from 100 Myr to 5 Gyr. The three panels show the rotation tracks for stars with masses of 0.50 M⊙ (upper panel), 0.75 M⊙ (middle panel), and 1.00 M⊙ (lower panel). The observational constraints on the rotational evolution of stars at the 10th percentile (downward pointing triangles), 50th percentile (squares), and 90th percentile (upward pointing triangles) of the rotation distribution. The horizontal dashed lines show the saturation thresholds for the mass loss rates and dipole field strengths.
Current usage metrics show cumulative count of Article Views (full-text article views including HTML views, PDF and ePub downloads, according to the available data) and Abstracts Views on Vision4Press platform.
Data correspond to usage on the plateform after 2015. The current usage metrics is available 48-96 hours after online publication and is updated daily on week days.
Initial download of the metrics may take a while.