Fig. 2
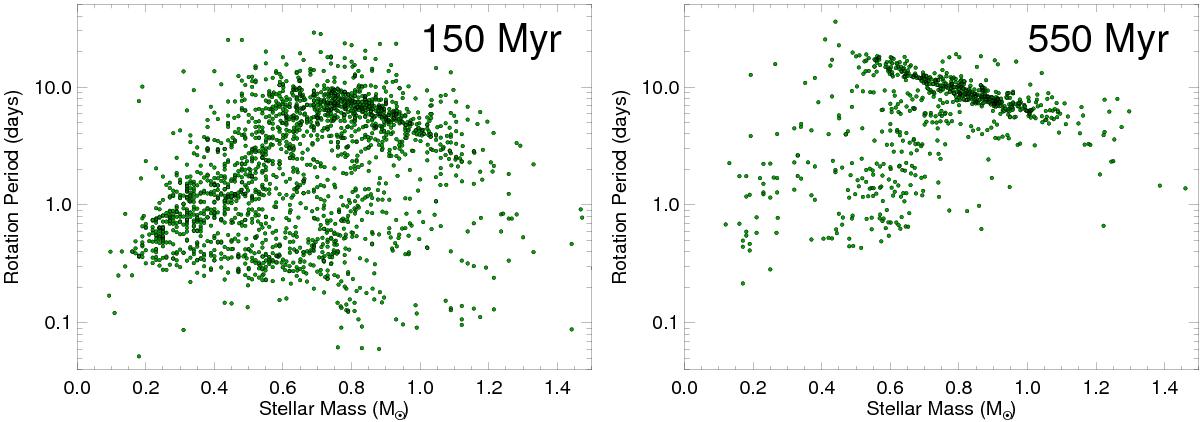
Distributions of stellar rotation rates at ~150 Myr (left panel) and at ~550 Myr (right panel). The distribution at ~150 Myr is a combination of measurements in the Pleiades, M 50, M 35, and NGC 2516 and the distribution at ~550 Myr is a combination of measurements from M 37 and Praesepe, as discussed in the text. Histograms showing the distributions of rotation periods in different mass bins for these two sets of stars are shown in Fig. 3.
Current usage metrics show cumulative count of Article Views (full-text article views including HTML views, PDF and ePub downloads, according to the available data) and Abstracts Views on Vision4Press platform.
Data correspond to usage on the plateform after 2015. The current usage metrics is available 48-96 hours after online publication and is updated daily on week days.
Initial download of the metrics may take a while.