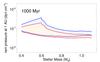
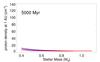
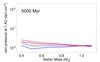
Fig. 14
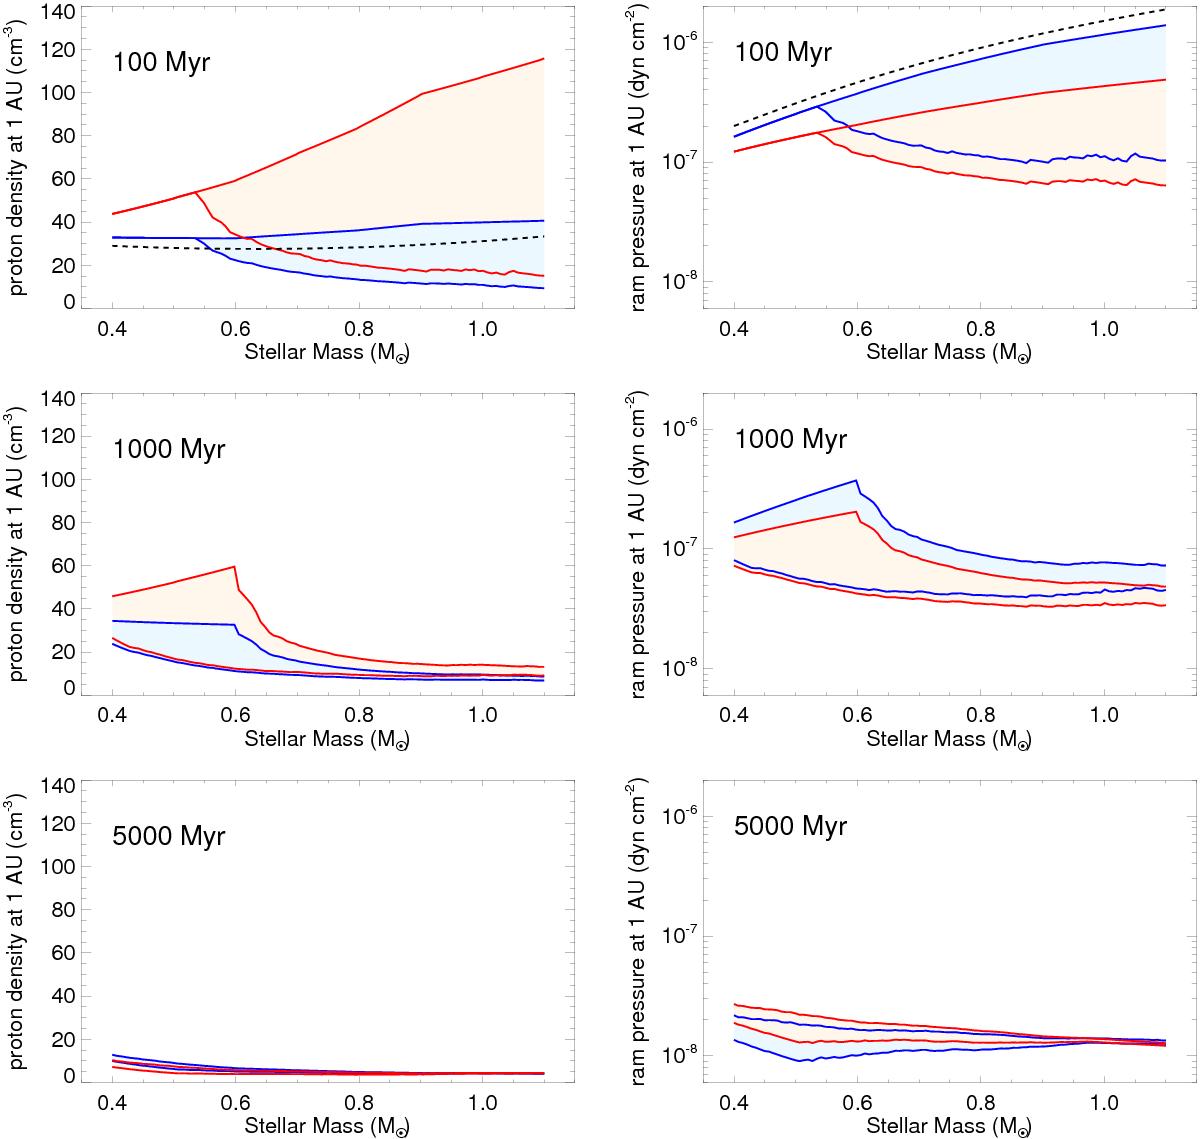
Proton densities (left column) and ram pressures (right column) as a function of stellar mass at three different stellar ages for the slow wind component. In each panel, blue corresponds to Model A and red corresponds to Model B, and the lower and upper lines correspond to the 10th and 90th percentiles of the rotational distributions.
Current usage metrics show cumulative count of Article Views (full-text article views including HTML views, PDF and ePub downloads, according to the available data) and Abstracts Views on Vision4Press platform.
Data correspond to usage on the plateform after 2015. The current usage metrics is available 48-96 hours after online publication and is updated daily on week days.
Initial download of the metrics may take a while.