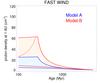
Fig. 11
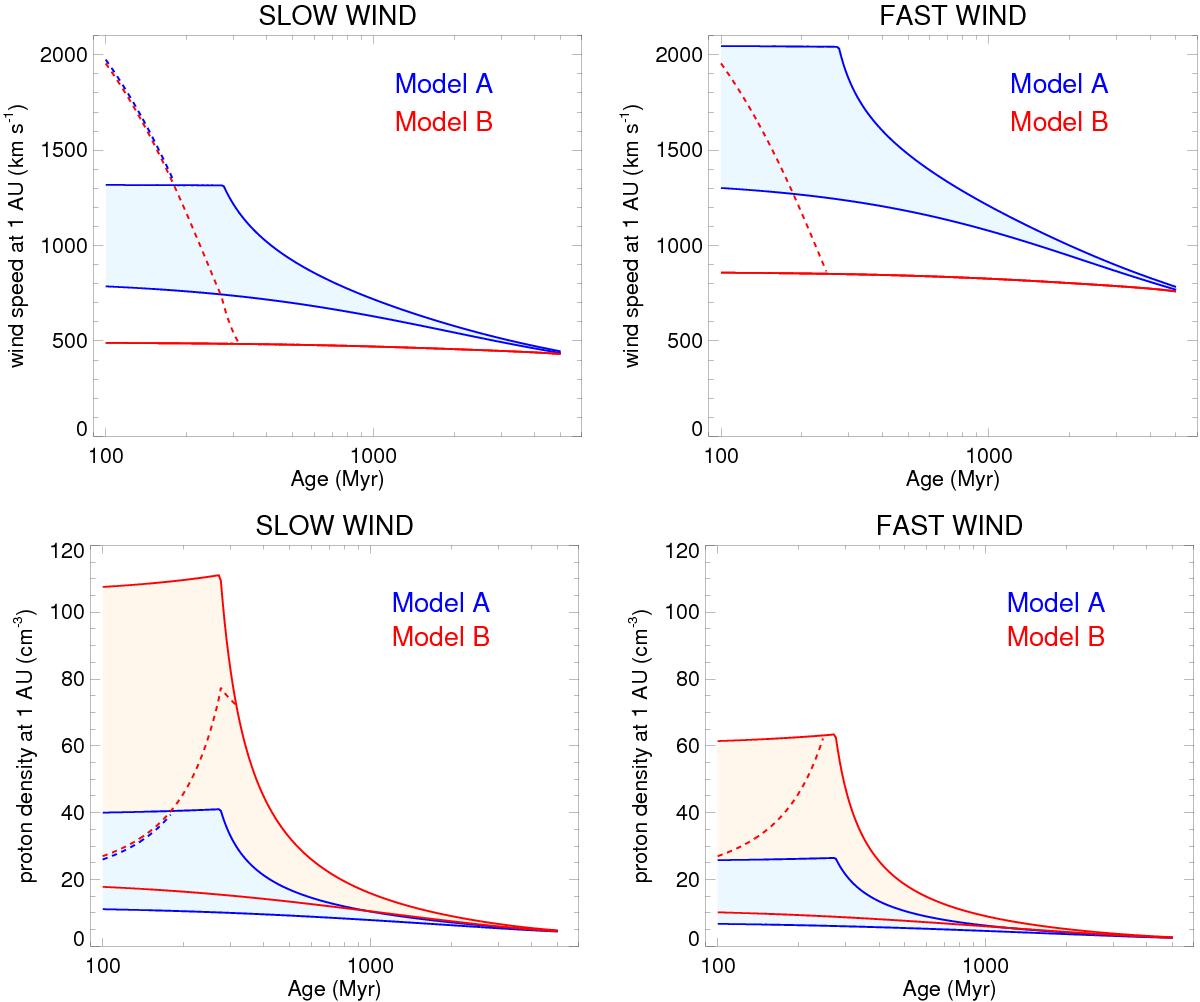
Evolution of the solar wind speed (upper row) and density (lower row) at 1 AU on the main-sequence. In all panels, the lower and upper lines show the properties along the 10th and 90th percentile rotation tracks respectively. We show the evolution of the slow (left column) and fast (right column) components for both Model A (blue) and Model B (red). In all panels, the solid lines show the wind properties assuming only thermal pressure driving of the wind and the dashed lines show the results for the 90th percentile track at 1 AU in the equatorial plane taking into account magneto-rotational acceleration of the wind, as described in Sect. 6.1.
Current usage metrics show cumulative count of Article Views (full-text article views including HTML views, PDF and ePub downloads, according to the available data) and Abstracts Views on Vision4Press platform.
Data correspond to usage on the plateform after 2015. The current usage metrics is available 48-96 hours after online publication and is updated daily on week days.
Initial download of the metrics may take a while.