Fig. 10
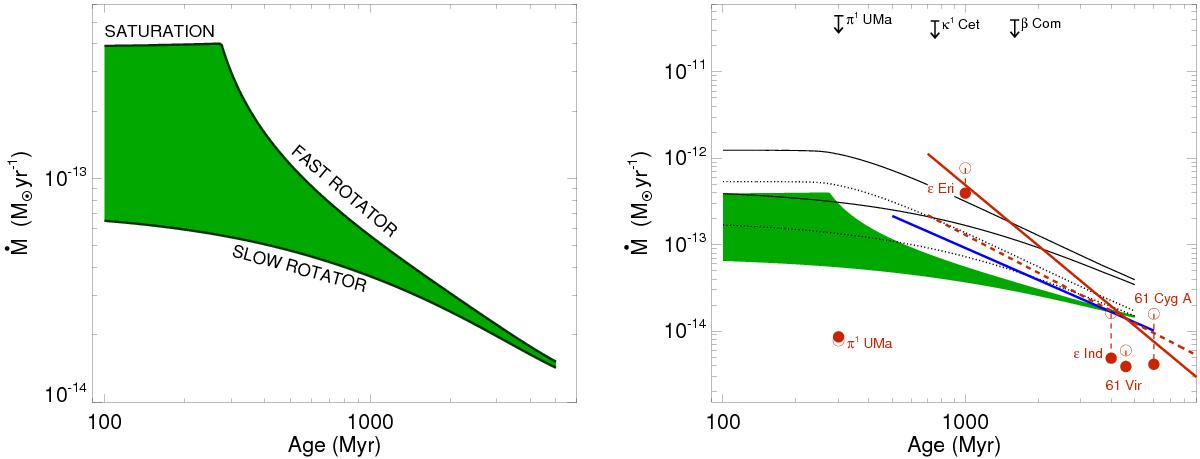
Evolution of the solar wind mass loss rate with age on the main-sequence. Left panel: mass loss rates that we derive from our rotational evolution models, such that ![]() for a given stellar radius and mass. Lower and upper lines show Ṁ⋆ along the 10th and 90th percentile rotation tracks respectively. Right panel: comparison of these estimates with other constraints on the mass loss rates of solar mass stars from the literature. The green shaded region shows the results of our wind model, as shown in the left panel. The solid black lines show the predictions of the model developed by Cranmer & Saar (2011b), calculated using the BOREAS code, along our 10th and 90th percentile rotation tracks. The dotted black lines show the same thing, but with all of the mass loss rates scaled down by a factor of 2.3 in order to make the prediction for the mass loss rate of the current solar wind match our value. The solid blue line shows the current solar wind mass loss rate extrapolated into the past by assuming a time dependence of t-1.23, as predicted by Suzuki et al. (2013). The three black downward pointing arrows show the upper limits on the mass loss rates for three young solar analogues derived from non-detections of radio emission by Gaidos et al. (2000). The solid red line shows the solar wind extrapolated into the past assuming a time dependence of t-2.33, as suggested by Wood et al. (2005) from measurements of astrospheric Lyα absorption, and the dashed red line shows the t-1.46 dependence that we derive in Sect. 6.2 using the results of Wood et al. (2005). The red circles show measurements of the mass loss rates of several stars using this technique by Wood et al. (2005, 2014). The empty circles correspond to the reported mass loss rates normalised by the stellar surface areas,
for a given stellar radius and mass. Lower and upper lines show Ṁ⋆ along the 10th and 90th percentile rotation tracks respectively. Right panel: comparison of these estimates with other constraints on the mass loss rates of solar mass stars from the literature. The green shaded region shows the results of our wind model, as shown in the left panel. The solid black lines show the predictions of the model developed by Cranmer & Saar (2011b), calculated using the BOREAS code, along our 10th and 90th percentile rotation tracks. The dotted black lines show the same thing, but with all of the mass loss rates scaled down by a factor of 2.3 in order to make the prediction for the mass loss rate of the current solar wind match our value. The solid blue line shows the current solar wind mass loss rate extrapolated into the past by assuming a time dependence of t-1.23, as predicted by Suzuki et al. (2013). The three black downward pointing arrows show the upper limits on the mass loss rates for three young solar analogues derived from non-detections of radio emission by Gaidos et al. (2000). The solid red line shows the solar wind extrapolated into the past assuming a time dependence of t-2.33, as suggested by Wood et al. (2005) from measurements of astrospheric Lyα absorption, and the dashed red line shows the t-1.46 dependence that we derive in Sect. 6.2 using the results of Wood et al. (2005). The red circles show measurements of the mass loss rates of several stars using this technique by Wood et al. (2005, 2014). The empty circles correspond to the reported mass loss rates normalised by the stellar surface areas, ![]() , and the solid circles correspond to
, and the solid circles correspond to ![]() , where R⋆ and M⋆ are in solar units. We have chosen an age of 4 Gyr for ϵ Ind based on King et al. (2010), though significant uncertainty exists in the age determination of this star (see Sect. 7.3 of King et al. 2010).
, where R⋆ and M⋆ are in solar units. We have chosen an age of 4 Gyr for ϵ Ind based on King et al. (2010), though significant uncertainty exists in the age determination of this star (see Sect. 7.3 of King et al. 2010).
Current usage metrics show cumulative count of Article Views (full-text article views including HTML views, PDF and ePub downloads, according to the available data) and Abstracts Views on Vision4Press platform.
Data correspond to usage on the plateform after 2015. The current usage metrics is available 48-96 hours after online publication and is updated daily on week days.
Initial download of the metrics may take a while.