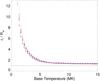
Fig. 8
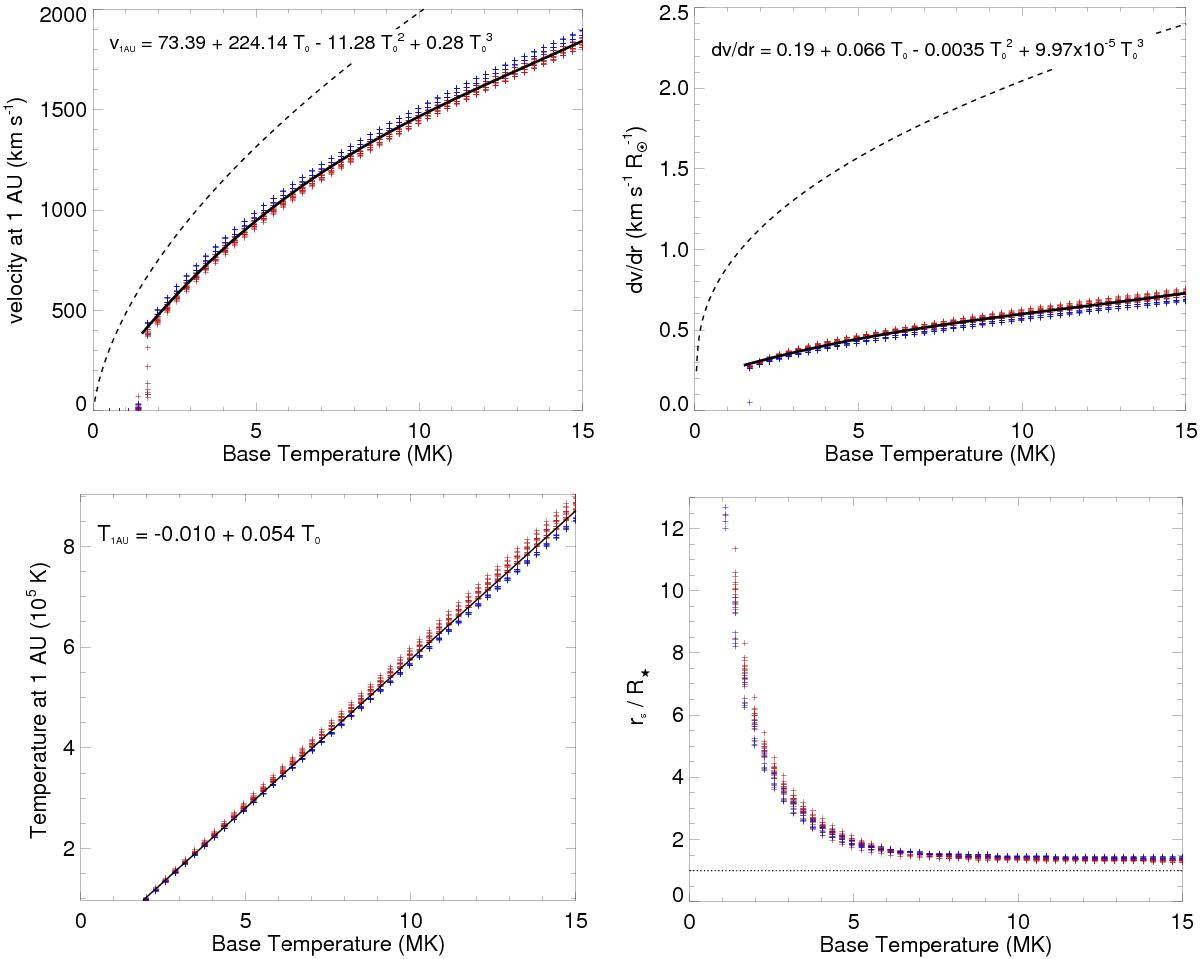
Results of the grid of 1D hydrodynamic wind models with differing base temperatures, stellar masses, and stellar radii, as discussed in Sect. 5.1. The plots show wind velocity at 1 AU (upper left panel), the average wind acceleration between 30 R⋆ and 1 AU (upper right panel), the wind temperature at 1 AU (lower left panel), and the radius at which the wind becomes supersonic (lower right panel), against wind base temperature for all models. Clearly temperature is the most important parameter in determining the properties of the wind. The small spreads in each parameter at each temperature is a result of differing surface escape velocities for stars with different masses and radii. At low temperatures, the wind does not have enough energy to expand and no wind is possible. The red and blue points represent stellar masses above and below 0.65 M⊙ respectively. The dashed lines in the upper panels show the predictions for an isothermal Parker wind from a 1 M⊙ and 1 R⊙ star.
Current usage metrics show cumulative count of Article Views (full-text article views including HTML views, PDF and ePub downloads, according to the available data) and Abstracts Views on Vision4Press platform.
Data correspond to usage on the plateform after 2015. The current usage metrics is available 48-96 hours after online publication and is updated daily on week days.
Initial download of the metrics may take a while.