Fig. 6
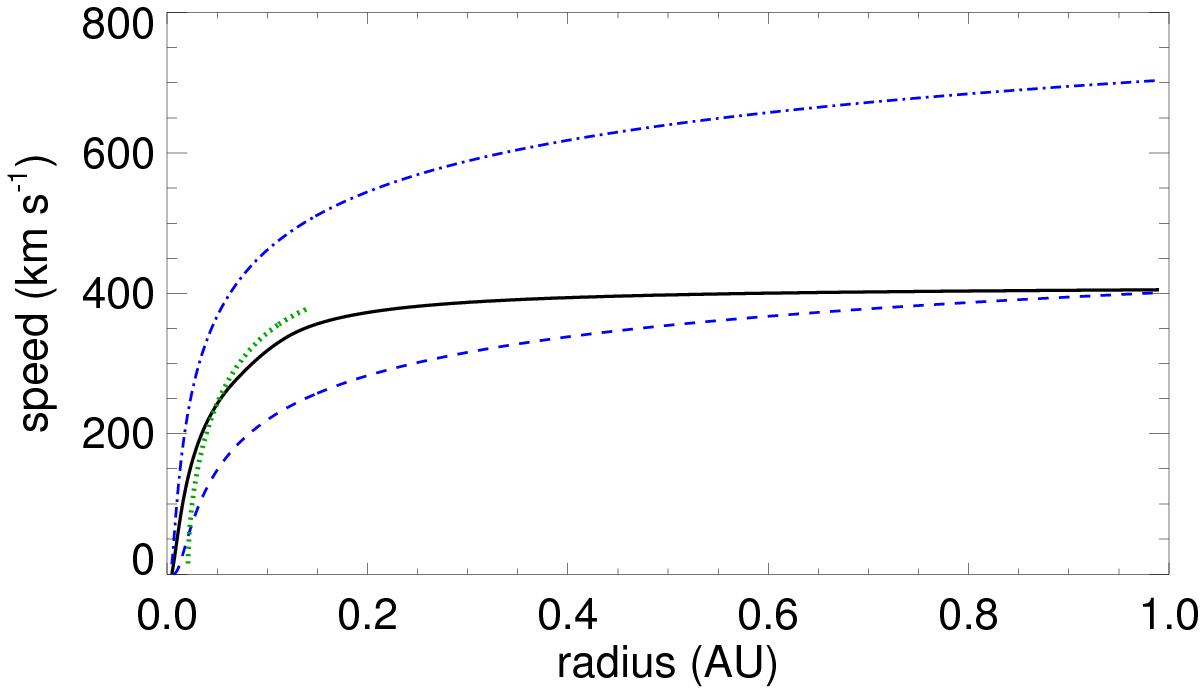
Comparison of velocity structure of our slow solar wind model with the isothermal Parker wind model. The solid black line represents our slow wind model and the blue lines show isothermal winds. The blue dot-dashed line shows an isothermal wind with the same temperature as the base temperatures of our slow wind and the blue dashed line shows an isothermal wind with the temperature reduced to a value that leads to the same wind speed at 1 AU as in our wind model. The dotted green line shows the slow wind velocity profile estimated by Sheeley et al. (1997) described in the caption of Fig. 3.
Current usage metrics show cumulative count of Article Views (full-text article views including HTML views, PDF and ePub downloads, according to the available data) and Abstracts Views on Vision4Press platform.
Data correspond to usage on the plateform after 2015. The current usage metrics is available 48-96 hours after online publication and is updated daily on week days.
Initial download of the metrics may take a while.