Fig. 5
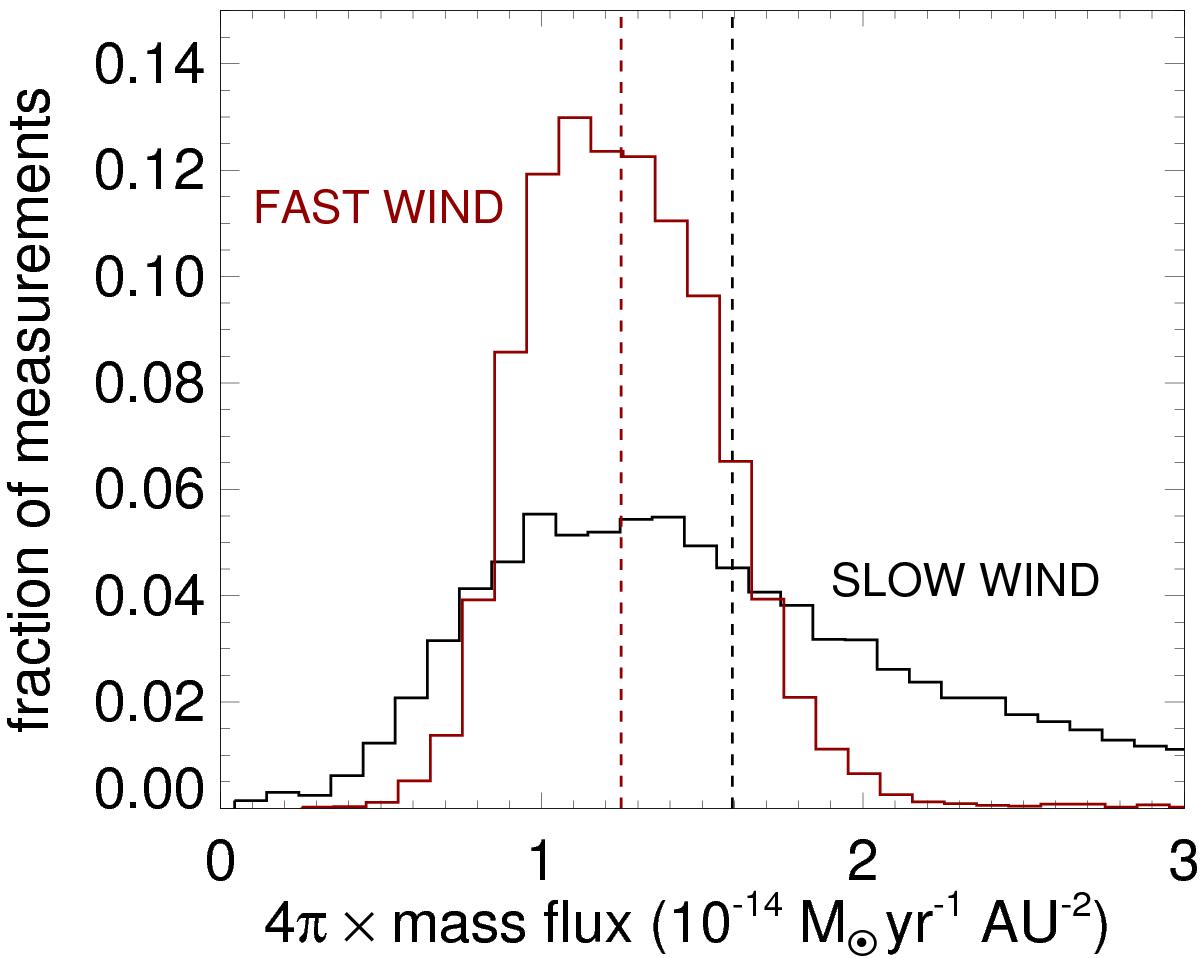
Histogram of the mass flux at 1 AU in the solar wind based on hourly average measurements from ACE for the slow wind (black) and Ulysses for the fast wind (red). The values are represented in units of M⊙ yr-1 AU-2 and have been multiplied by 4π so that they can be compared with the total mass loss rate of the solar wind. The vertical dashed lines show mass loss rates derived from the wind models of 1.6 × 10⁻¹⁴ M⊙ yr-1 and 1.2 × 10⁻¹⁴ M⊙ yr-1 for the slow and fast winds respectively. These are very similar to the medians for the two distributions shown in this figure.
Current usage metrics show cumulative count of Article Views (full-text article views including HTML views, PDF and ePub downloads, according to the available data) and Abstracts Views on Vision4Press platform.
Data correspond to usage on the plateform after 2015. The current usage metrics is available 48-96 hours after online publication and is updated daily on week days.
Initial download of the metrics may take a while.