Fig. 4
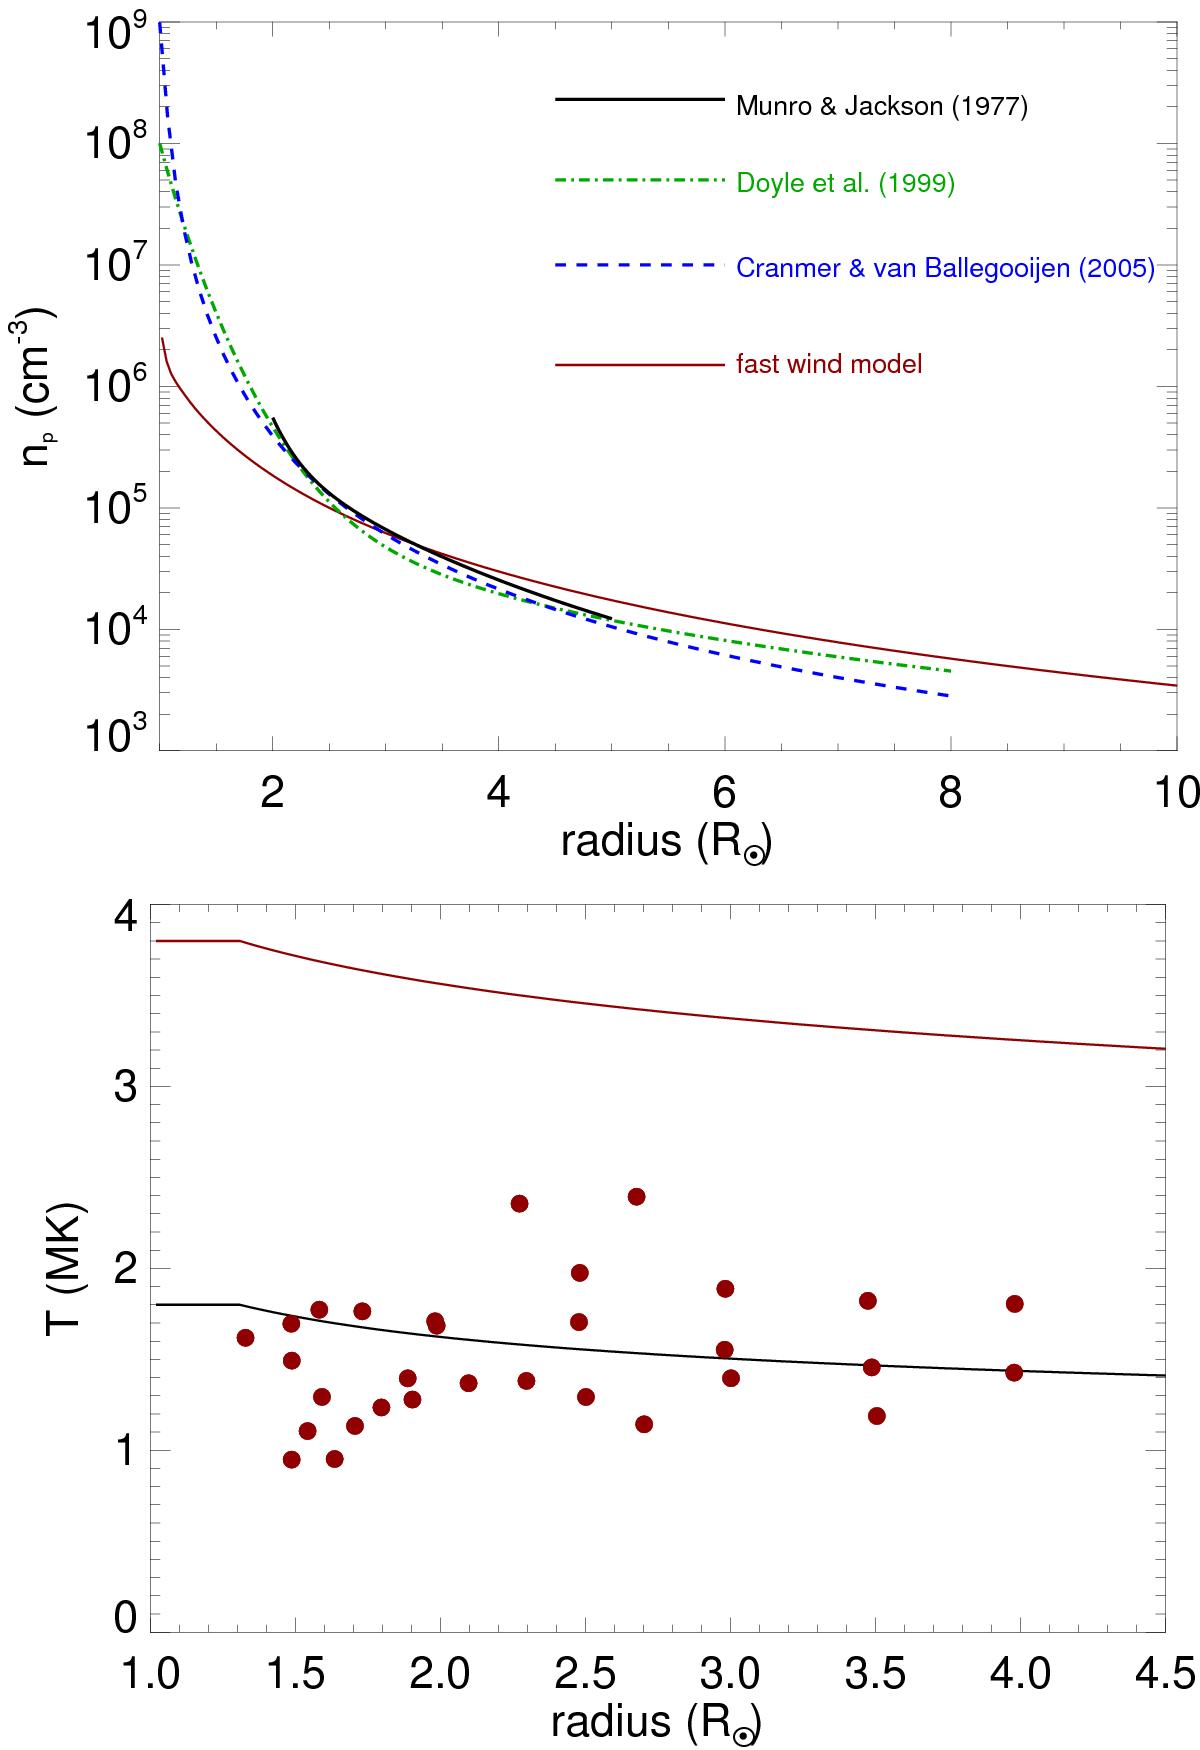
Comparison of our fast solar wind model to observed properties of the real fast solar wind close to the solar surface. Upper panel: proton densities within 10 R⊙ of the solar surface in our fast wind model compared to observational electron density profiles inside and above coronal holes from Munro & Jackson (1977), Doyle et al. (1999), and Cranmer & van Ballegooijen (2005). Lower panel: wind temperature within 4.5 R⊙ compared to measurements of wind temperatures in coronal holes (red circles) compiled by Cranmer (2004). As in Fig. 3, the red and black lines in the lower panel show the fast and slow wind simulations respectively.
Current usage metrics show cumulative count of Article Views (full-text article views including HTML views, PDF and ePub downloads, according to the available data) and Abstracts Views on Vision4Press platform.
Data correspond to usage on the plateform after 2015. The current usage metrics is available 48-96 hours after online publication and is updated daily on week days.
Initial download of the metrics may take a while.