Fig. 3
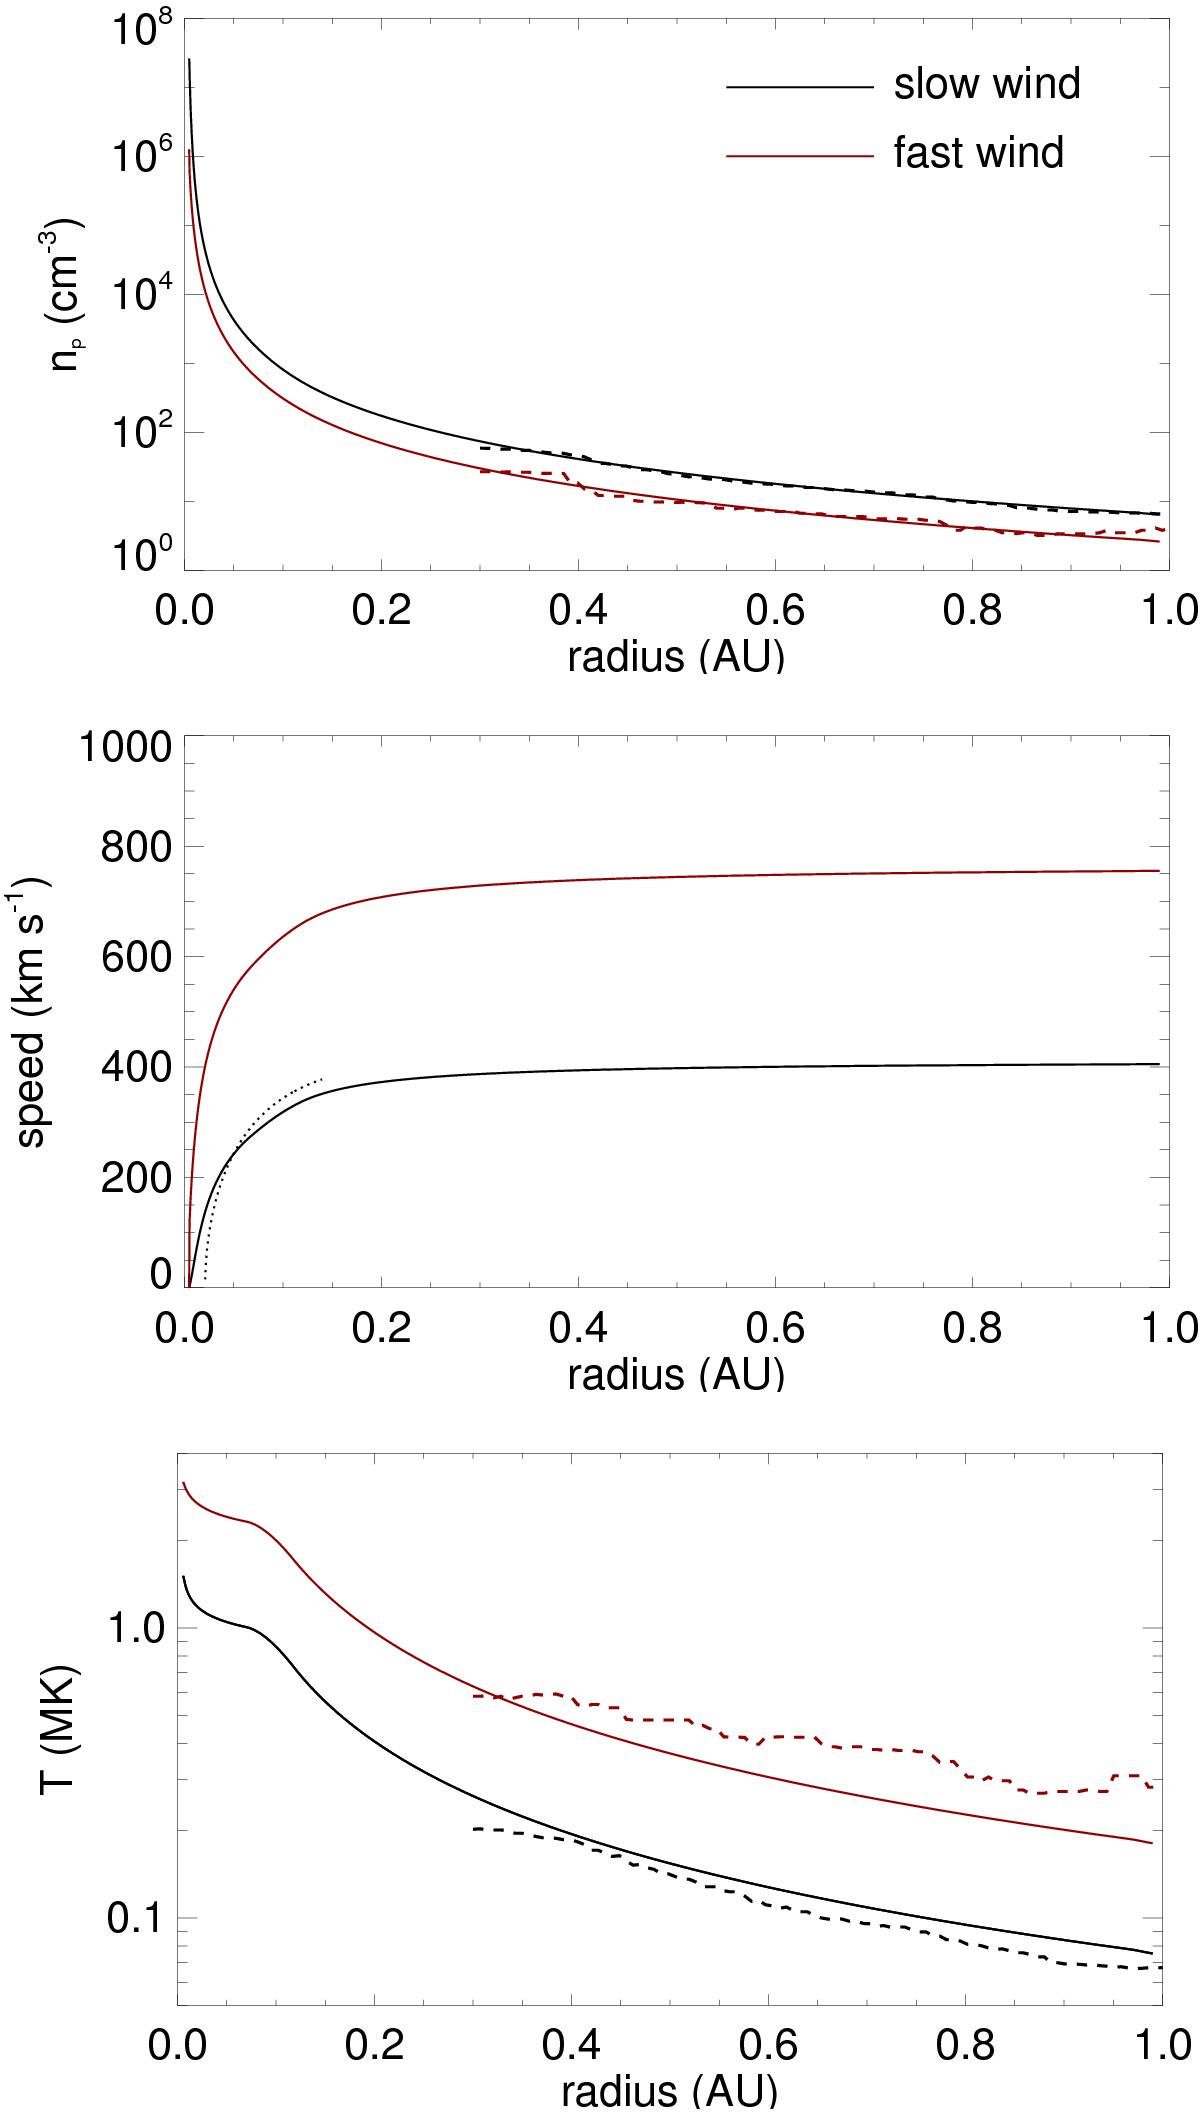
Proton number density (upper panel), wind speed (middle panel), and temperature (lower panel) of our slow and fast wind models. As in Fig. 2, the black and red lines corresponds to the slow and fast winds respectively. The dashed lines in the upper and lower panels show the Helios A and Helios B measurements of the slow and fast wind properties, as described in Sect. 3.2. The dotted line in the middle panel shows the radial speed profile of the slow wind estimated by Sheeley et al. (1997). The line corresponds to ![]() , where va = 418.7 km s-1, ra = 15.2R⊙, and r1 = 4.5R⊙.
, where va = 418.7 km s-1, ra = 15.2R⊙, and r1 = 4.5R⊙.
Current usage metrics show cumulative count of Article Views (full-text article views including HTML views, PDF and ePub downloads, according to the available data) and Abstracts Views on Vision4Press platform.
Data correspond to usage on the plateform after 2015. The current usage metrics is available 48-96 hours after online publication and is updated daily on week days.
Initial download of the metrics may take a while.