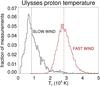
Fig. 2
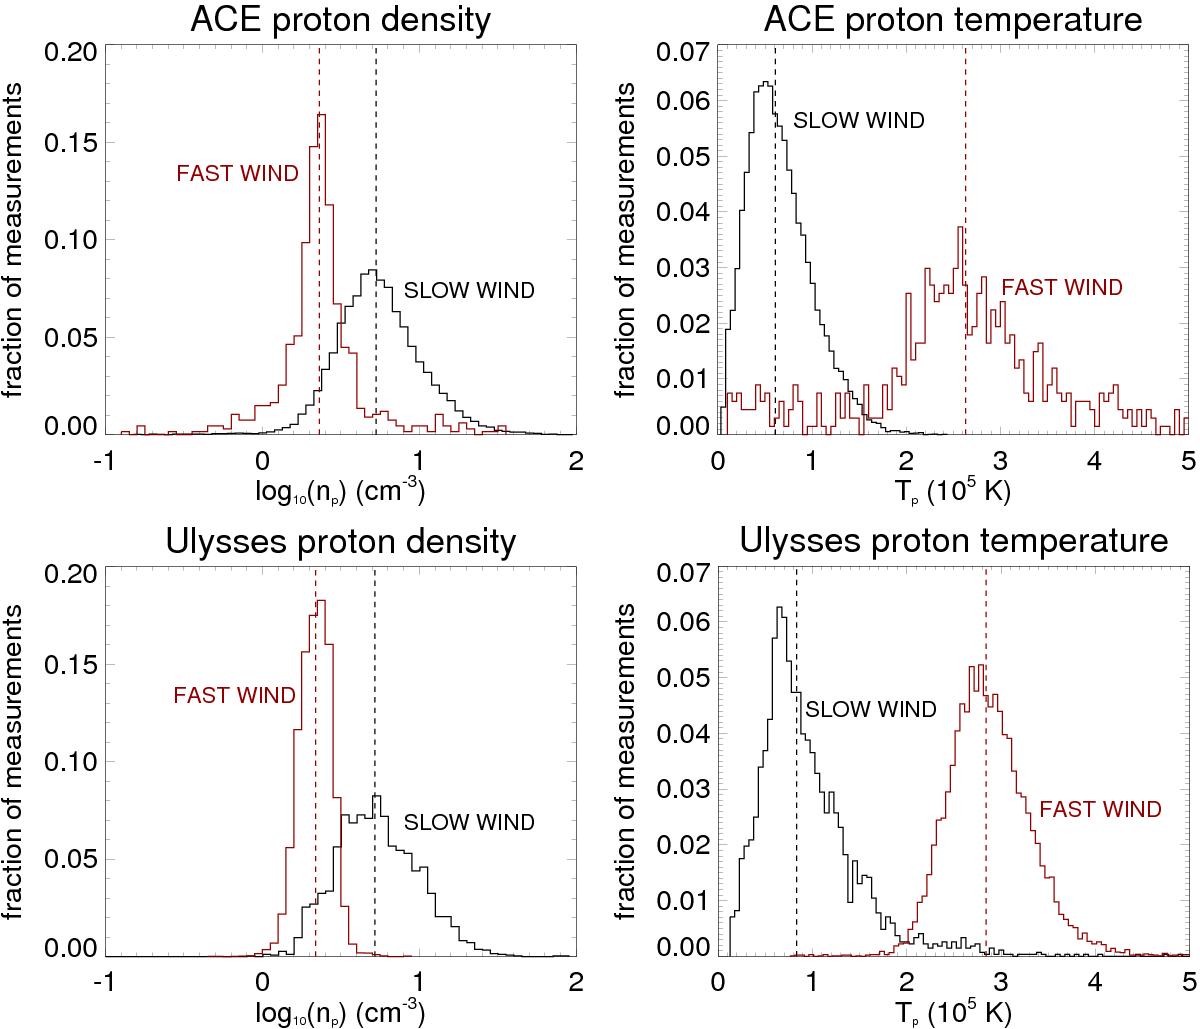
Histograms of the proton densities (left column) and proton temperatures (right column) of the solar wind at 1 AU. The values are measured in situ by the ACE spacecraft (upper row) and the Ulysses spacecraft (lower row). The black lines show the measurements of the slow wind, defined as all wind with speeds at 1 AU between 380 km s-1 and 420 km s-1. The red lines show the measurements of the fast wind, defined as all wind with speeds at 1 AU between 740 km s-1 and 780 km s-1. The vertical dashed lines show the median values of each quantity, as given in Table 1. Ulysses was on an eccentric orbit between 1 AU and 5 AU, and therefore to construct the histograms for the density and temperature at 1 AU, we only consider data taken from when the spacecraft was less than 2.5 AU from the Sun, which we extrapolate back to 1 AU, as described in Sect. 3.2.
Current usage metrics show cumulative count of Article Views (full-text article views including HTML views, PDF and ePub downloads, according to the available data) and Abstracts Views on Vision4Press platform.
Data correspond to usage on the plateform after 2015. The current usage metrics is available 48-96 hours after online publication and is updated daily on week days.
Initial download of the metrics may take a while.