Fig. 6
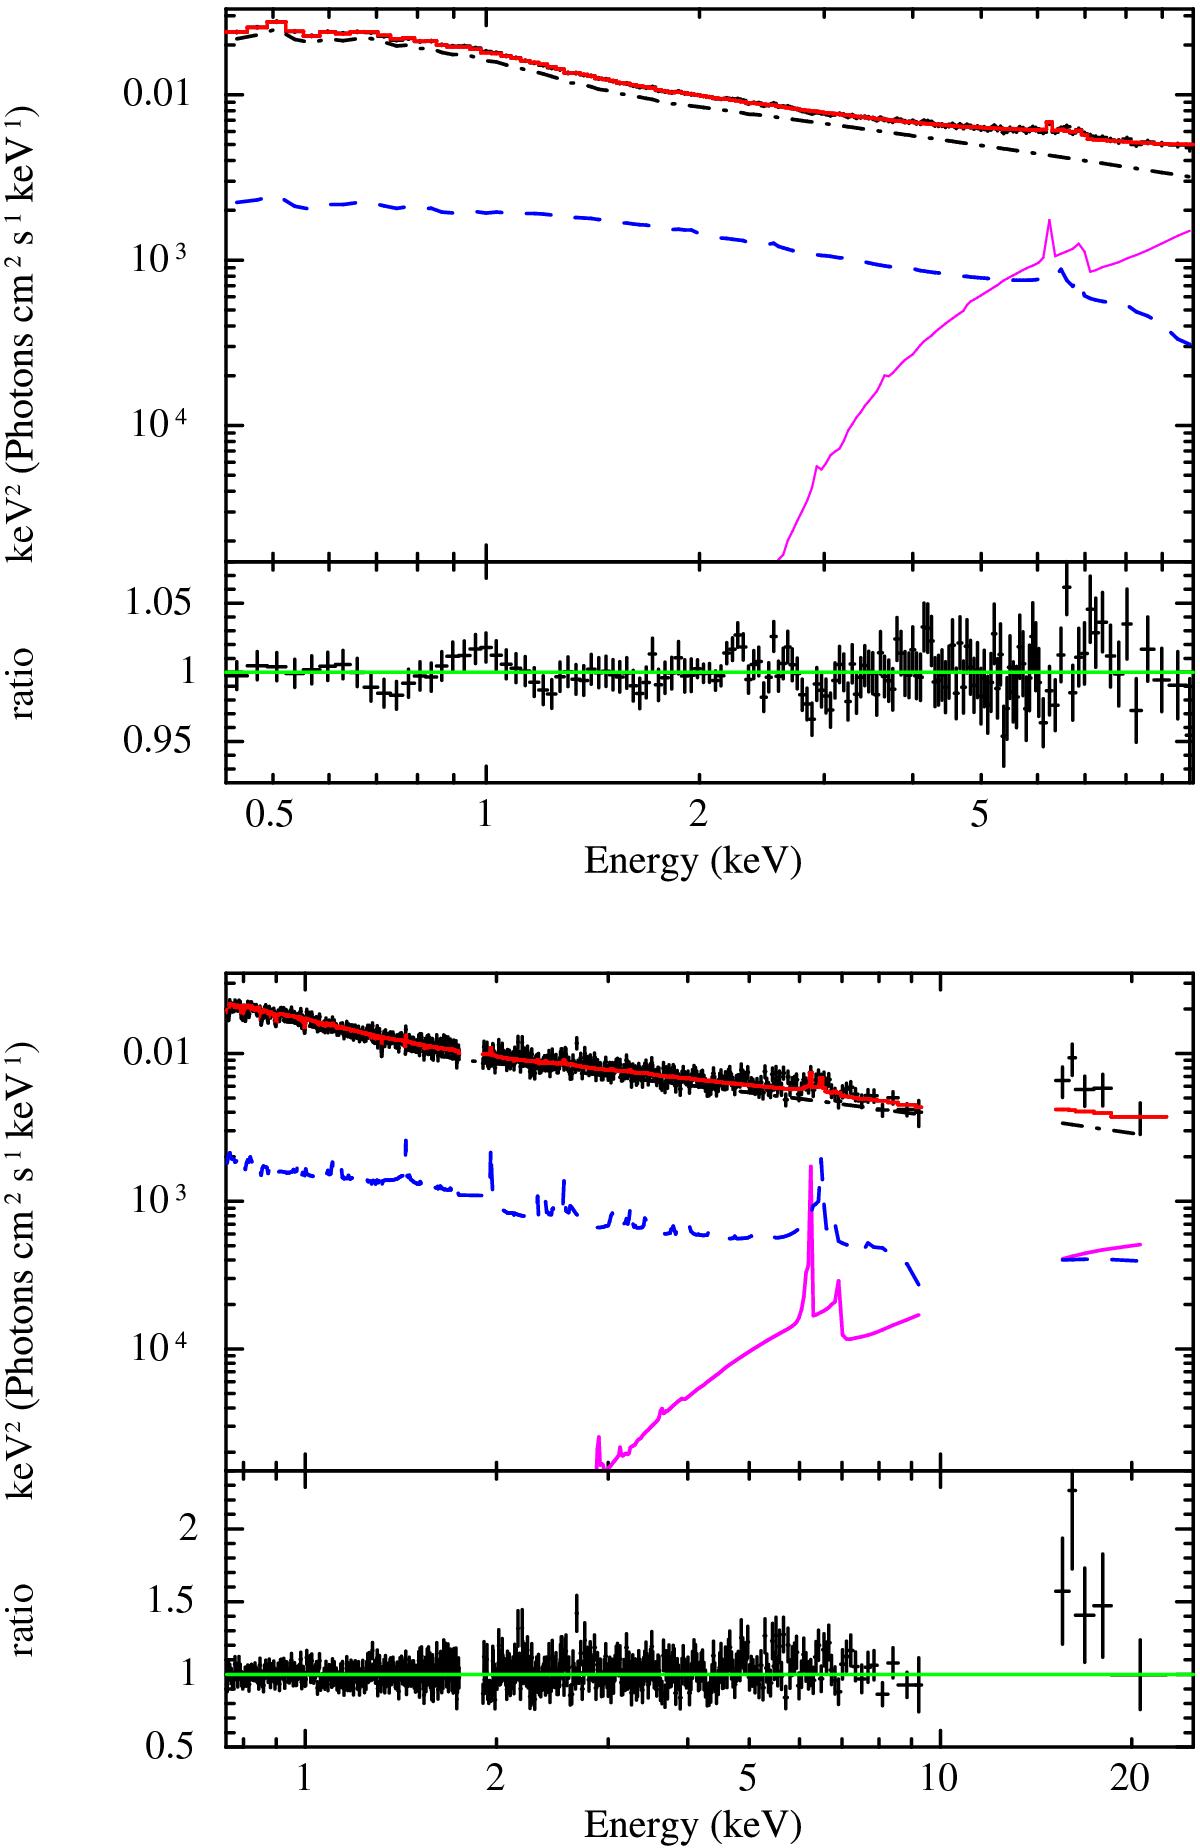
EPIC pn (top) and Suzaku XIS+PIN (bottom) spectra unfolded against the best-fit model described in Table 6, along with data-to-model ratios. The intrinsic continuum emission is modelled with optxagn (dotted-dashed black line); two reflectors are modelled with xillver, a highly ionised (dashed blue line) and a cold, absorbed one (solid magenta line). The total model is plotted in red.
Current usage metrics show cumulative count of Article Views (full-text article views including HTML views, PDF and ePub downloads, according to the available data) and Abstracts Views on Vision4Press platform.
Data correspond to usage on the plateform after 2015. The current usage metrics is available 48-96 hours after online publication and is updated daily on week days.
Initial download of the metrics may take a while.