Fig. 12
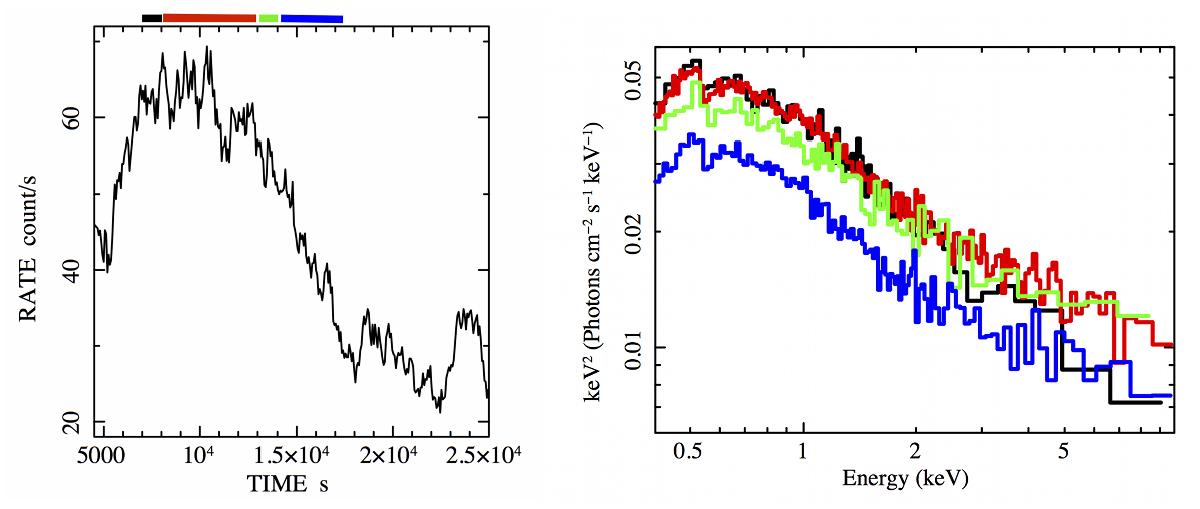
Left panel: a segment of the 0.4−10 keV light curve of the pn observation 901 where a strong and sudden increase and decrease in flux is evident. Right panel: four 0.2−10 keV EPIC-pn spectral slices extracted at the beginning (during the first ks) of the high-flux level (black), during the remaining of the high-flux level (red), during the first ks of the decrease in flux (green), and during the remaining decreasing flux level (blue): the time intervals are marked in the top panel with the same colour-code. Error bars have been omitted for clarity.
Current usage metrics show cumulative count of Article Views (full-text article views including HTML views, PDF and ePub downloads, according to the available data) and Abstracts Views on Vision4Press platform.
Data correspond to usage on the plateform after 2015. The current usage metrics is available 48-96 hours after online publication and is updated daily on week days.
Initial download of the metrics may take a while.