Fig. 11
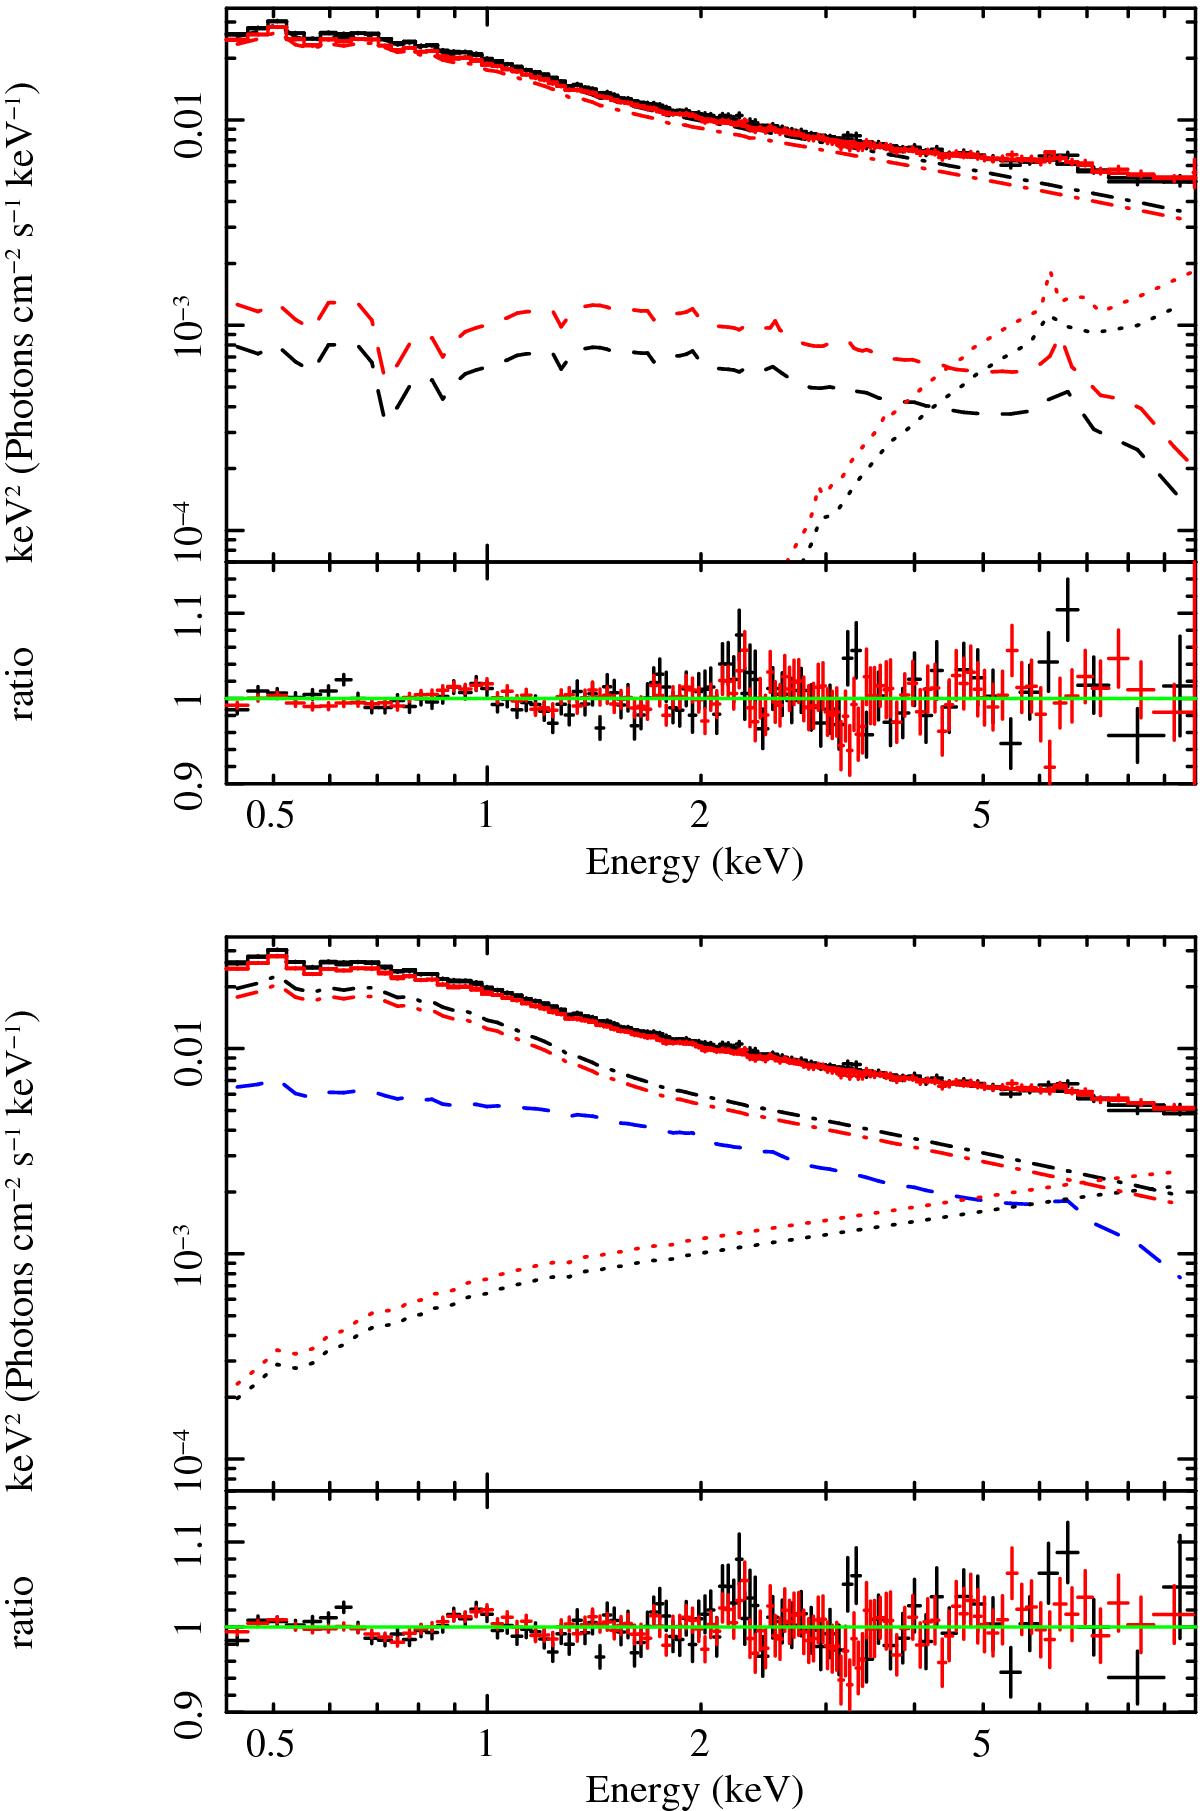
Top panel: soft flares (black) and their associated delayed signal (black) spectra unfolded against a reflection-dominated model: optxagn (dotted-dashed lines), a heavily absorbed cold reflector (dotted lines), and a slightly absorbed hot reflector (dashed lines). Bottom panel: same as above, but unfolded against a Compton-upscattering-dominated model: optxagn (dotted-dashed lines), a hot reflector (blue dashed line), and a hot Compton-upscattering model (dotted lines).
Current usage metrics show cumulative count of Article Views (full-text article views including HTML views, PDF and ePub downloads, according to the available data) and Abstracts Views on Vision4Press platform.
Data correspond to usage on the plateform after 2015. The current usage metrics is available 48-96 hours after online publication and is updated daily on week days.
Initial download of the metrics may take a while.