Free Access
Fig. 4
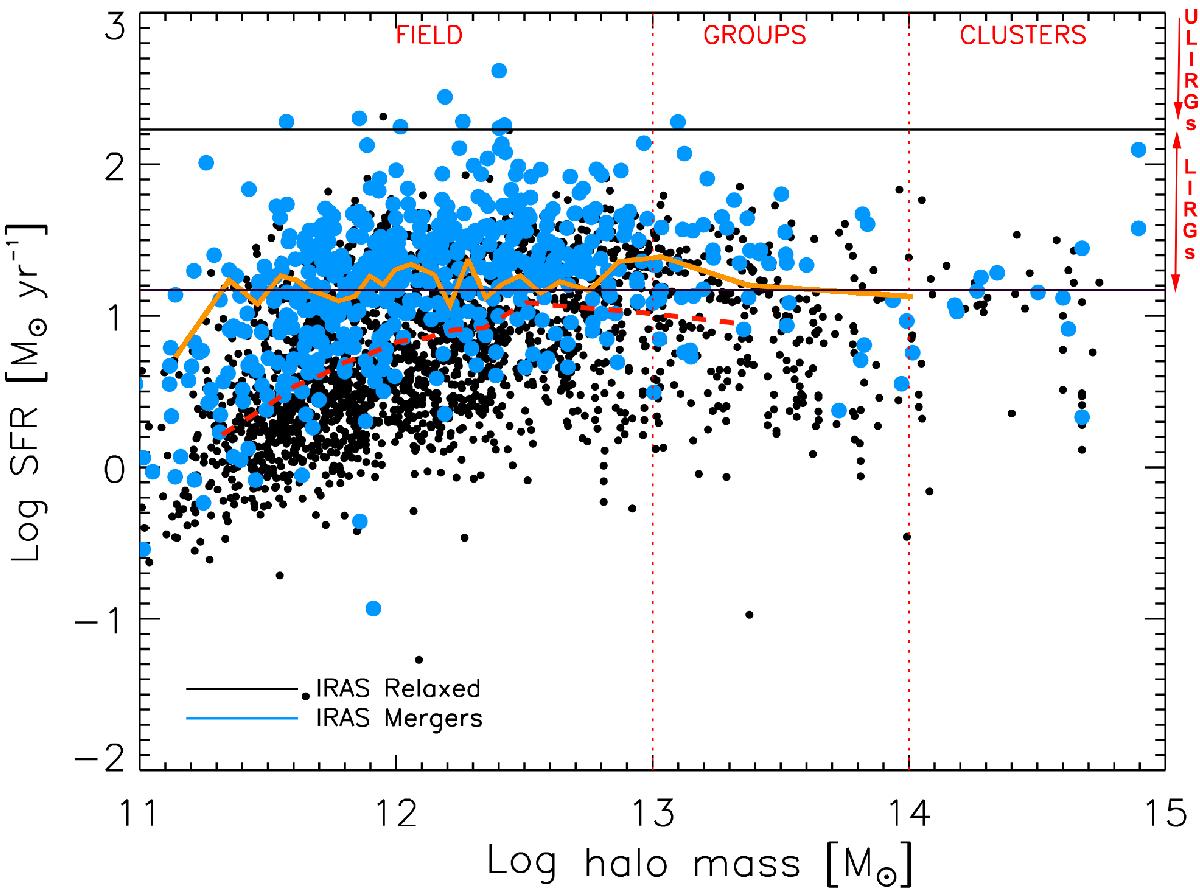
Star formation rate (SFR) of the IRAS-detected mergers (blue) and the LTG control sample (black) plotted against local environment. The plot also shows a progressive one-sigma fit to the mergers (solid orange) and control sample (dashed red).
Current usage metrics show cumulative count of Article Views (full-text article views including HTML views, PDF and ePub downloads, according to the available data) and Abstracts Views on Vision4Press platform.
Data correspond to usage on the plateform after 2015. The current usage metrics is available 48-96 hours after online publication and is updated daily on week days.
Initial download of the metrics may take a while.