Fig. 6
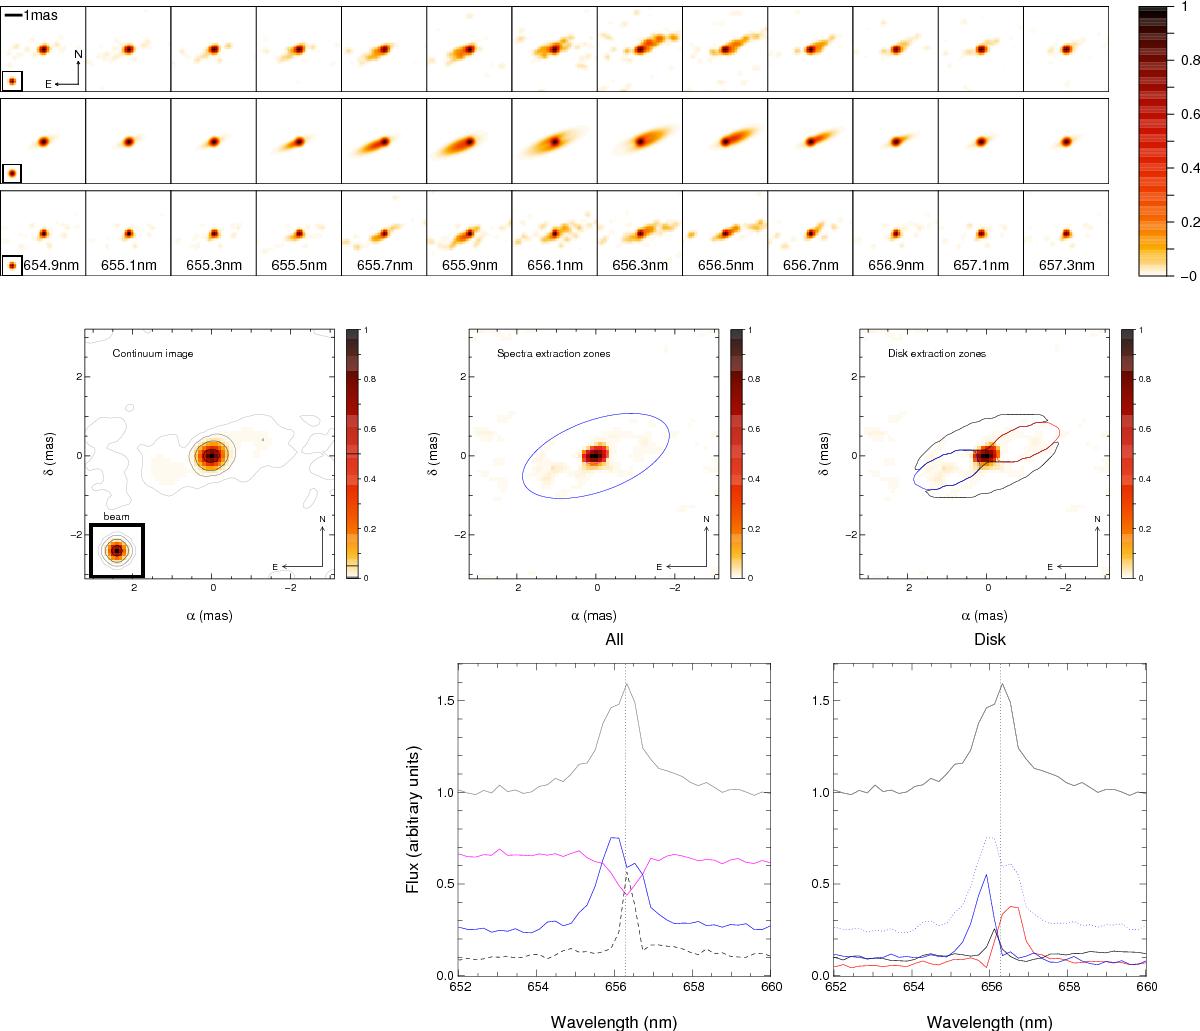
Top row: sequence of intensity maps (6.4 × 6.4 mas) as a function of wavelength with north up and east left as imaged by VEGA (upper sequence), as computed from the kinematic model in Sect. 6.2 (middle sequence), and as imaged through a simulated observation of the above model (lower sequence). Middle row: at the left, we present the continuum image convolved to the diffraction limit of VEGA (0.2 mas) together with contours at 50, 5, 0.5 and 0.05% of the peak intensity to show the disk contour. The middle and right panels show the selected zones to extract the spectra presented below together with an unconvolved continuum image of the system. Bottom row: extracted spectra for the different spatial components: 1) Bottom middle: extracted fluxes (top: total flux, pink absorption feature: “star” zone, blue emission feature: “disk” zone, and dashed spectrum: all other contributions); 2) bottom right: decomposition of the “disk” zone: the top spectrum is the total flux. The blue and red lines correspond to the blue- and redshifted emission features, while the central zeroshifted emission feature comes from all other parts of the “disk” zone.
Current usage metrics show cumulative count of Article Views (full-text article views including HTML views, PDF and ePub downloads, according to the available data) and Abstracts Views on Vision4Press platform.
Data correspond to usage on the plateform after 2015. The current usage metrics is available 48-96 hours after online publication and is updated daily on week days.
Initial download of the metrics may take a while.