Fig. 3
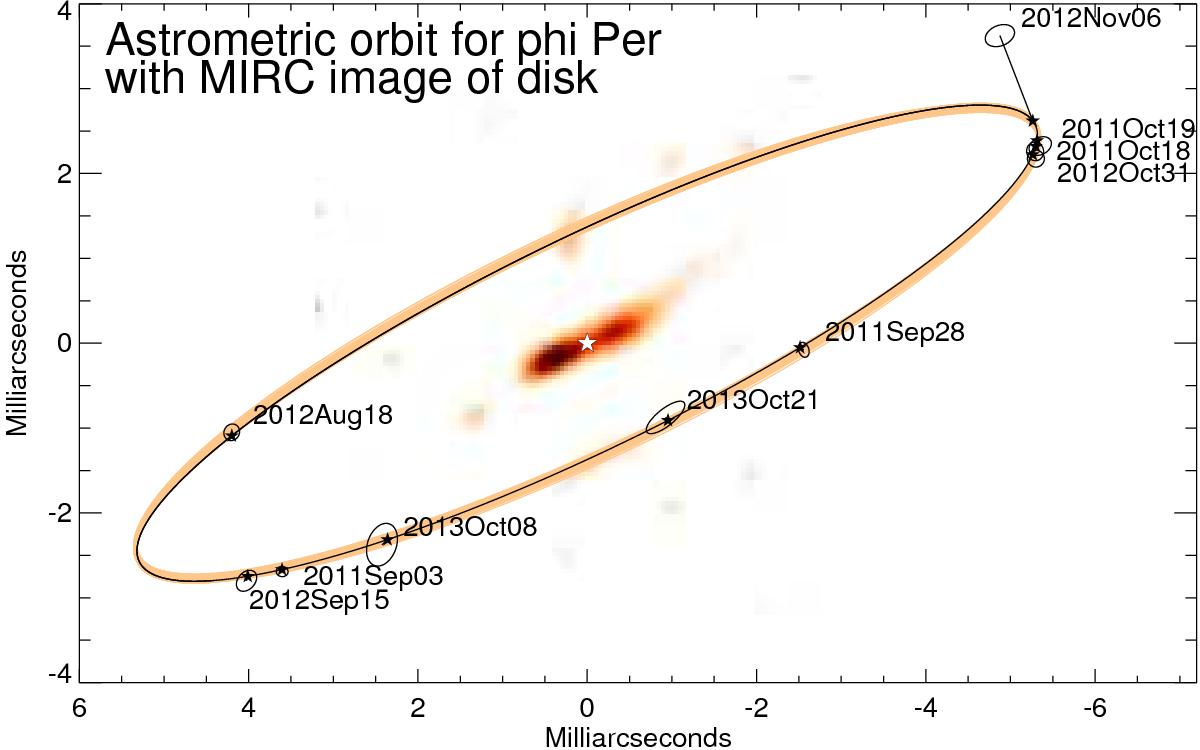
Image reconstruction made with MIRC data in the H band. Here we have separately modeled the contributions from the Be star and the companion, and this image represents the emission from the disk alone, contributing about ~29% of the total H-band flux. We have marked the location of the companion at the ten epochs reported here with error ellipses and show the best-fit circular orbit (see text). The colored band shows the results from 100 bootstrap fits to illustrate the errors on our orbital solution. East is left and north is up.
Current usage metrics show cumulative count of Article Views (full-text article views including HTML views, PDF and ePub downloads, according to the available data) and Abstracts Views on Vision4Press platform.
Data correspond to usage on the plateform after 2015. The current usage metrics is available 48-96 hours after online publication and is updated daily on week days.
Initial download of the metrics may take a while.