Fig. 9
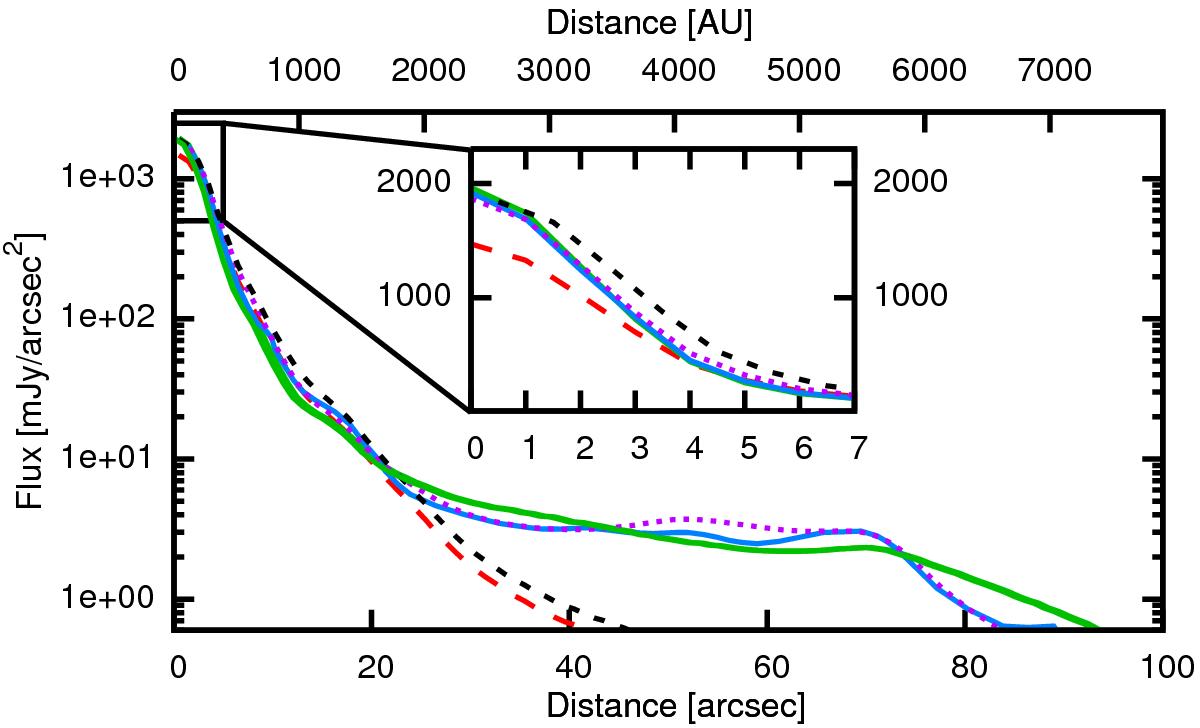
Fit to the radial intensity profiles observed by PACS at 70 μm. The blue and green solid lines represent the observed brightness distribution averaged over a narrow range of direction (Cox et al. 2012) and over all directions, respectively. The long dashed red line represents the model with Ṁ = 3 × 10⁻¹⁰M⊙ year-1, inner and outer radius of 40 AU and 1800 AU, respectively, and with grains composed of 40% metallic iron and 60% Ca2Mg0.5Al2Si1.5O7. The short dashed black line shows the model with Ṁ = 4 × 10⁻¹⁰M⊙ year-1, inner and outer radius of 50 AU and 1800 AU, respectively, and with grains composed of 50% metallic iron and 50% Ca2Mg0.5Al2Si1.5O7. The dotted purple line represents the model for the recent mass-loss history obtained in Sect. 3.7, with parameters given in Fig. 12 and with grains composed of 50% metallic iron and 50% Ca2Mg0.5Al2Si1.5O7. The radial distance in AU is given along the upper x-axis for an assumed distance of 78 parsecs.
Current usage metrics show cumulative count of Article Views (full-text article views including HTML views, PDF and ePub downloads, according to the available data) and Abstracts Views on Vision4Press platform.
Data correspond to usage on the plateform after 2015. The current usage metrics is available 48-96 hours after online publication and is updated daily on week days.
Initial download of the metrics may take a while.