Fig. 6
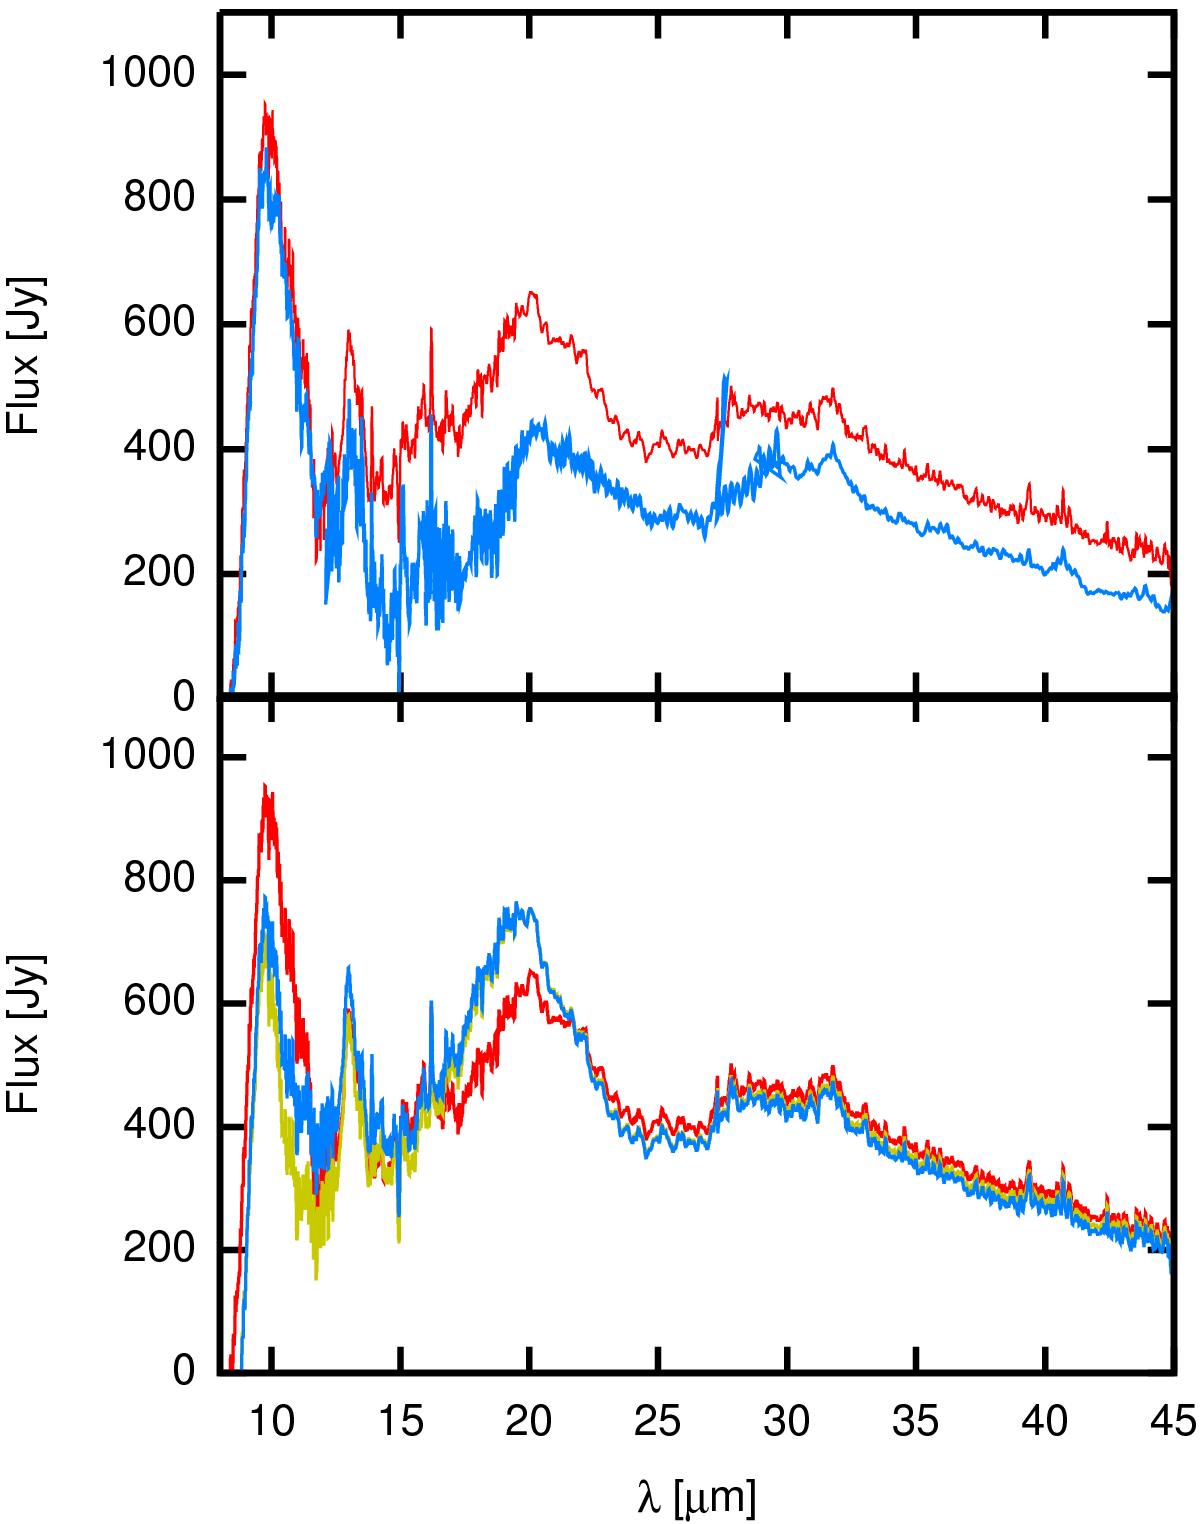
Al2O3-subtracted residual infrared spectrum of W Hya. Upper panel: residuals adopting the optical constants for aerosil particles from Koike et al. (1995) and the ISO spectra from the Sloan et al. (2003) database (in red) and Justtanont et al. (2004; in blue); lower panel: the red curve is the same as in the upper panel. The yellow and blue curves are for residuals assuming compact and porous particles from Begemann et al. (1997).
Current usage metrics show cumulative count of Article Views (full-text article views including HTML views, PDF and ePub downloads, according to the available data) and Abstracts Views on Vision4Press platform.
Data correspond to usage on the plateform after 2015. The current usage metrics is available 48-96 hours after online publication and is updated daily on week days.
Initial download of the metrics may take a while.