Fig. 2
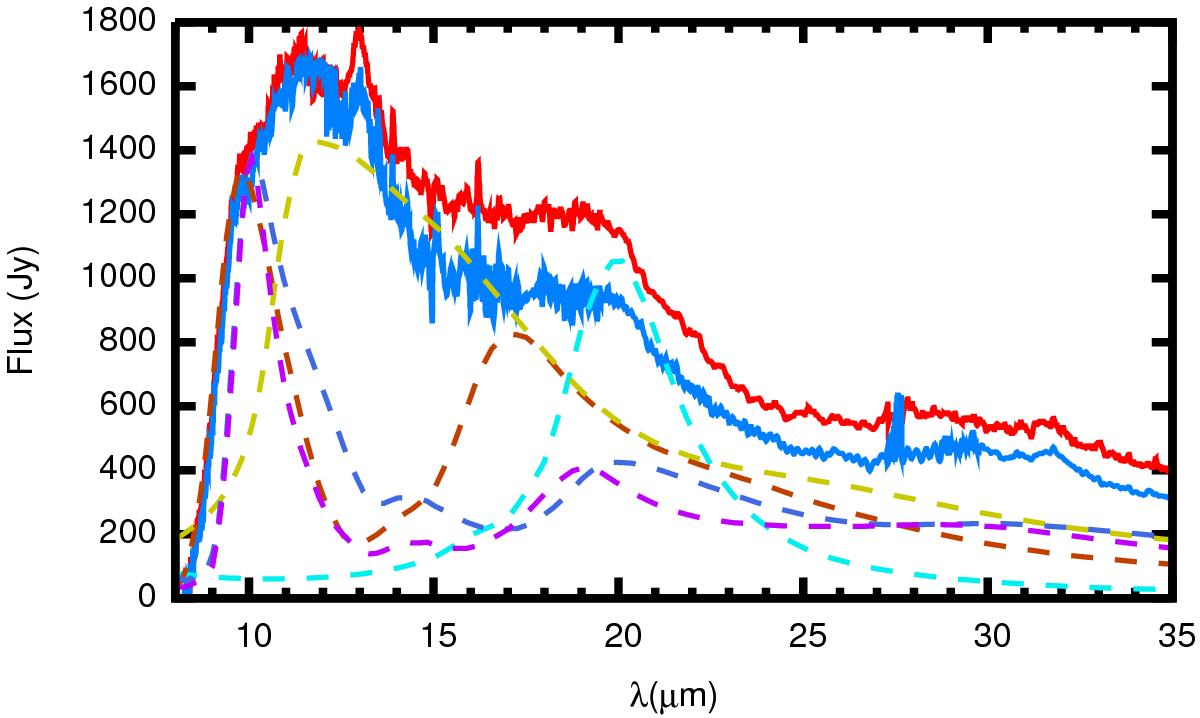
Continuum-subtracted ISO SWS spectra from 1996 and 1997 are shown by the red and blue lines. The opacity curves of amorphous Al2O3, MgFeSiO4, FeO, Ca2Mg0.5Al2Si1.5O7 and Ca2Al2SiO7 are shown by the yellow, light brown, light blue, purple, and blue dashed lines, respectively. The opacity curves are scaled to compared them with the stellar-continuum-subtracted spectrum.
Current usage metrics show cumulative count of Article Views (full-text article views including HTML views, PDF and ePub downloads, according to the available data) and Abstracts Views on Vision4Press platform.
Data correspond to usage on the plateform after 2015. The current usage metrics is available 48-96 hours after online publication and is updated daily on week days.
Initial download of the metrics may take a while.