Free Access
Fig. 12
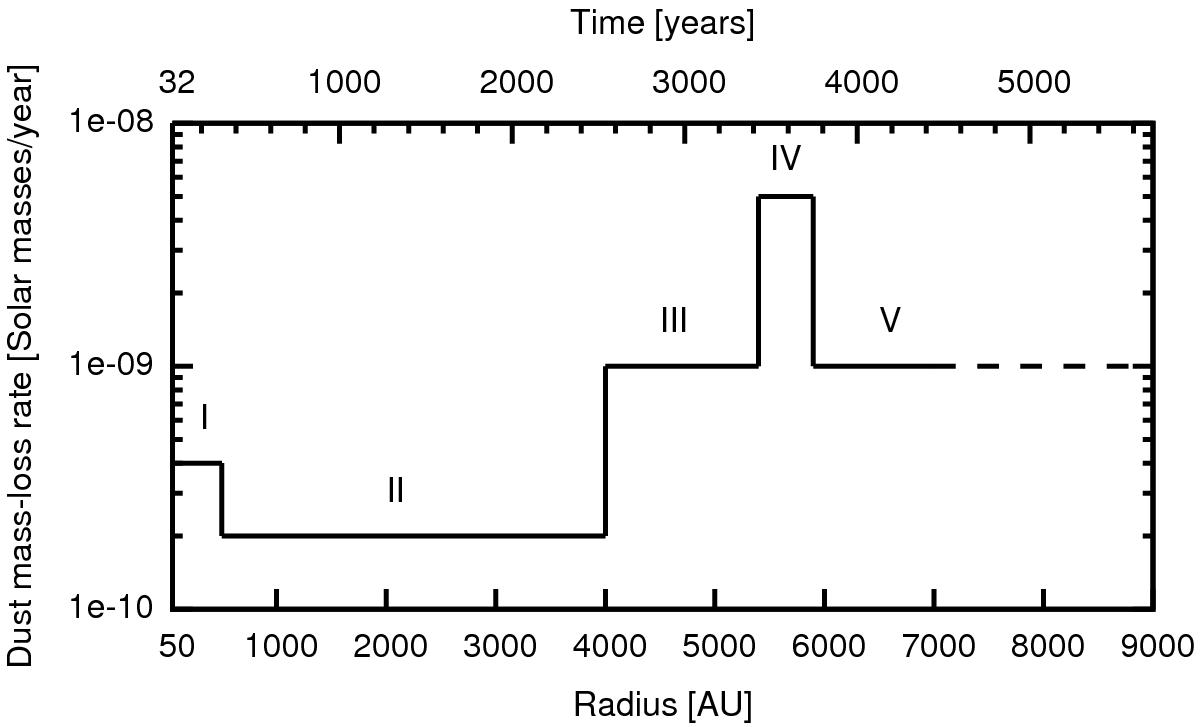
Schematic dust mass-loss history of W Hya. The mass-loss rate shown by the dashed line could not be constrained by our model. The timescales given along the upper x-axis is calculated assuming a constant expansion velocity of 7.5 km s-1.
Current usage metrics show cumulative count of Article Views (full-text article views including HTML views, PDF and ePub downloads, according to the available data) and Abstracts Views on Vision4Press platform.
Data correspond to usage on the plateform after 2015. The current usage metrics is available 48-96 hours after online publication and is updated daily on week days.
Initial download of the metrics may take a while.