Fig. 11
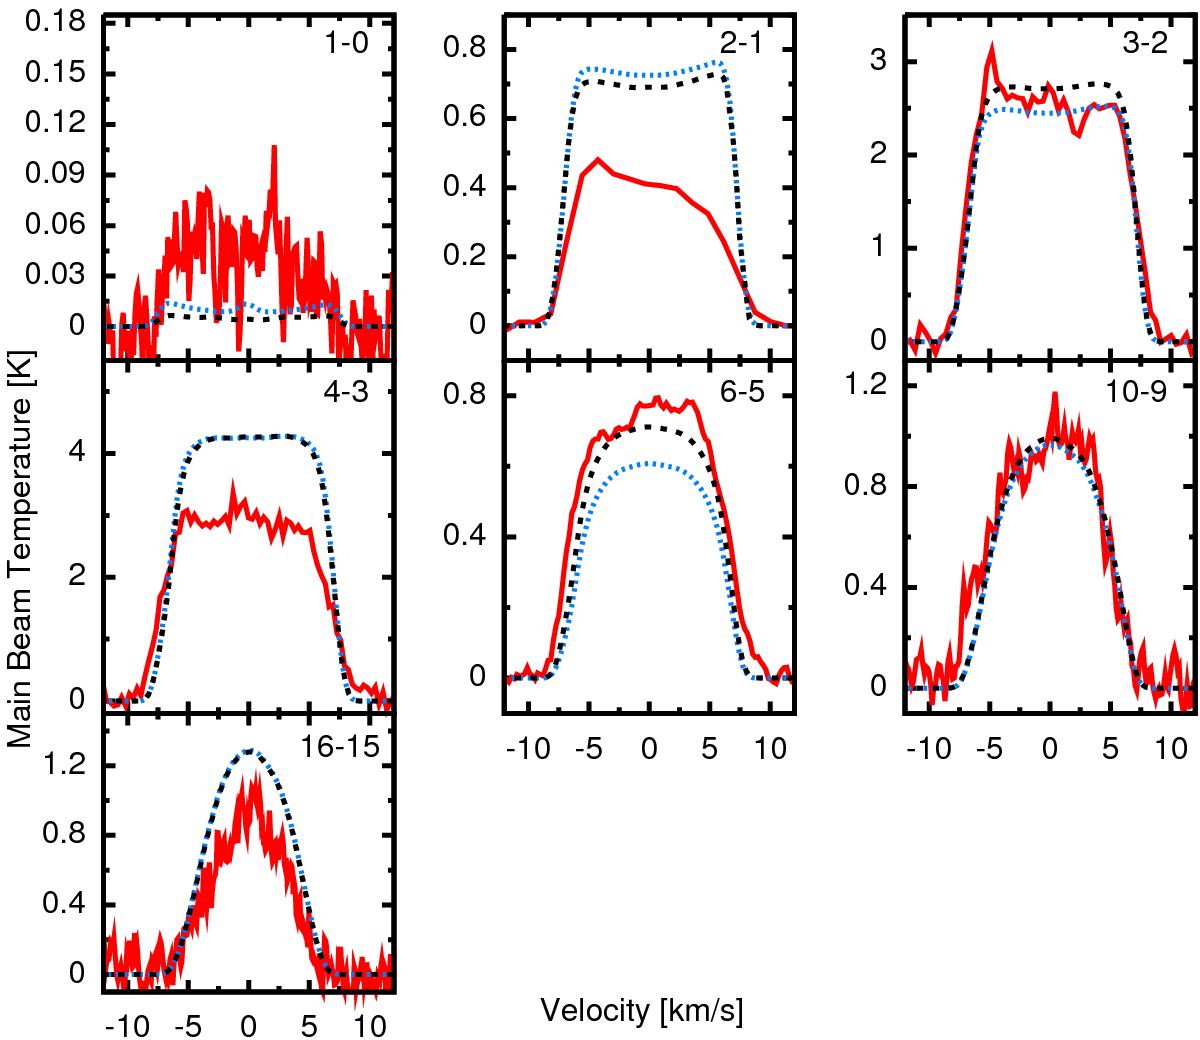
Comparison of the observed CO rotational emission lines (red solid line) to the model with mass-loss properties as described in the caption of Fig. 10 and a dissociation radius set to the canonical value obtained by Mamon et al. (1988; shown by the blue dotted line). The model obtained in Paper I is shown for comparison (black dashed line).
Current usage metrics show cumulative count of Article Views (full-text article views including HTML views, PDF and ePub downloads, according to the available data) and Abstracts Views on Vision4Press platform.
Data correspond to usage on the plateform after 2015. The current usage metrics is available 48-96 hours after online publication and is updated daily on week days.
Initial download of the metrics may take a while.