Fig. 1
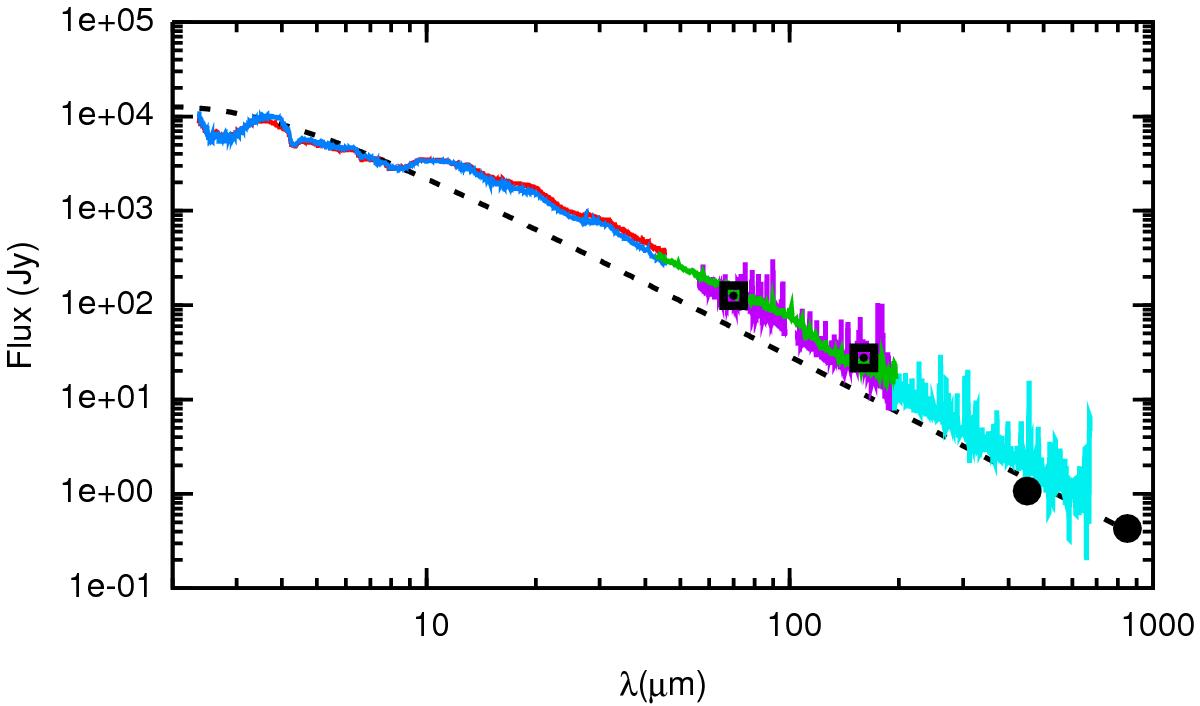
Compilation of all thermal emission observations of the dust in W Hya. The red and blue solid lines are the ISO SWS spectra from 1996 and 1997, respectively, the green solid line is the averaged ISO LWS spectrum, the purple and light blue solid lines are the PACS and SPIRE spectra, and the black squares and black circles depict the PACS and SCUBA photometric measurements. A black-body spectrum of 2500 K and 5400 L⊙ is overplotted to guide the eye (black dashed line).
Current usage metrics show cumulative count of Article Views (full-text article views including HTML views, PDF and ePub downloads, according to the available data) and Abstracts Views on Vision4Press platform.
Data correspond to usage on the plateform after 2015. The current usage metrics is available 48-96 hours after online publication and is updated daily on week days.
Initial download of the metrics may take a while.