Fig. 5
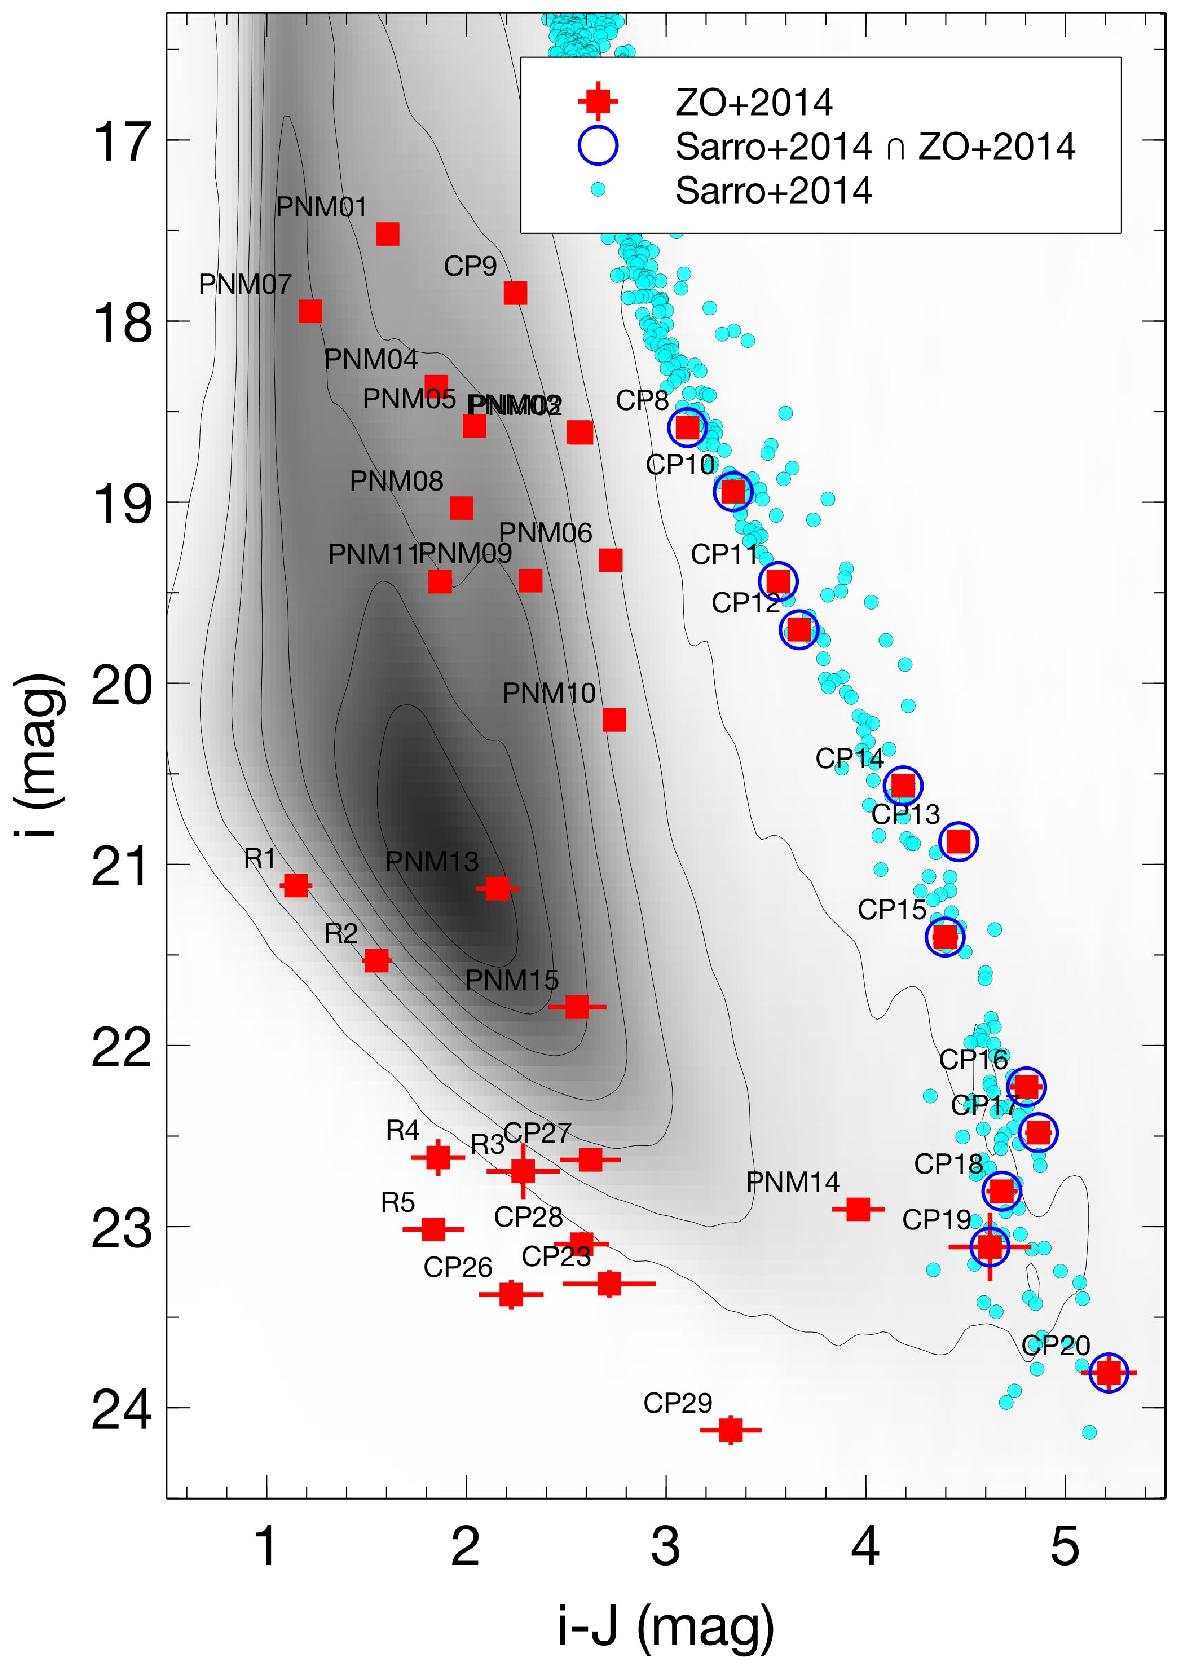
i vs. i − J color–magnitude diagram of the DANCe survey. High probability (≥0.95) sources are indicated as cyan dots. Candidate members from Zapatero Osorio et al. (2014b) with a i-band counterpart in the DANCe survey are represented with red squares. Their abbreviated names are also indicated. Candidate members from Zapatero Osorio et al. (2014b) previously discovered or reported in Sarro et al. (2014) are overplotted as large blue circles.
Current usage metrics show cumulative count of Article Views (full-text article views including HTML views, PDF and ePub downloads, according to the available data) and Abstracts Views on Vision4Press platform.
Data correspond to usage on the plateform after 2015. The current usage metrics is available 48-96 hours after online publication and is updated daily on week days.
Initial download of the metrics may take a while.